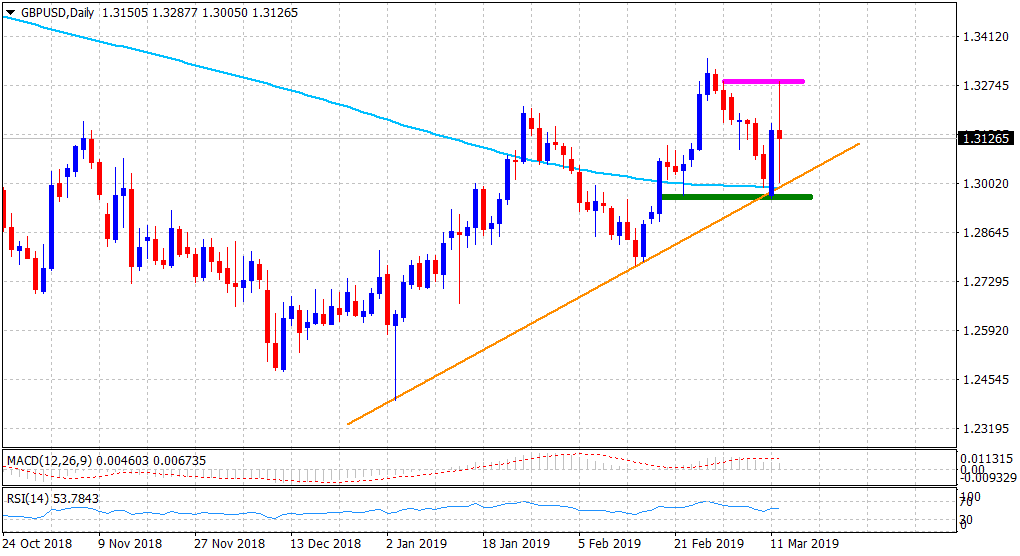
“¢ The pair stalled its sharp intraday downfall near the very important 200-day SMA and staged a remarkable recovery of around 130-140 pips from the key 1.30 psychological mark.
“¢ The pair’s resilience near the mentioned support clearly points to traders reluctant to place any aggressive bets ahead of the crucial vote on May’s amended withdrawal agreement.
“¢ The mentioned support coincides with a short-term ascending trend-line – extending from early-Jan./mid-Feb. swing lows, and should continue to act as a tough nut to crack for bears.
“¢ Hence, it would be prudent to wait for a convincing break through the mentioned support before traders start positioning aggressively for a further near-term depreciating move.
“¢ A sustained weakness below the said handle is likely to accelerate the fall further towards the 1.2900 round figure mark before the pair eventually slides further towards the 1.2800 handle.
“¢ Meanwhile, technical indicators on 4-hourly/daily charts maintained their bullish bias, through bulls are likely to wait for a convincing break through the 1.3285-90 horizontal resistance.
GBP/USD daily chart
GBP/USD
Overview:
Today Last Price: 1.3146
Today Daily change: -6 pips
Today Daily change %: -0.05%
Today Daily Open: 1.3152
Trends:
Daily SMA20: 1.3073
Daily SMA50: 1.298
Daily SMA100: 1.2884
Daily SMA200: 1.2986
Levels:
Previous Daily High: 1.3171
Previous Daily Low: 1.296
Previous Weekly High: 1.3269
Previous Weekly Low: 1.299
Previous Monthly High: 1.3351
Previous Monthly Low: 1.2773
Daily Fibonacci 38.2%: 1.309
Daily Fibonacci 61.8%: 1.3041
Daily Pivot Point S1: 1.3018
Daily Pivot Point S2: 1.2884
Daily Pivot Point S3: 1.2807
Daily Pivot Point R1: 1.3229
Daily Pivot Point R2: 1.3305
Daily Pivot Point R3: 1.344
