- GBP/USD shows little resilience off-late.
- One-week-old rising wedge surrounding monthly tops questions buyers.
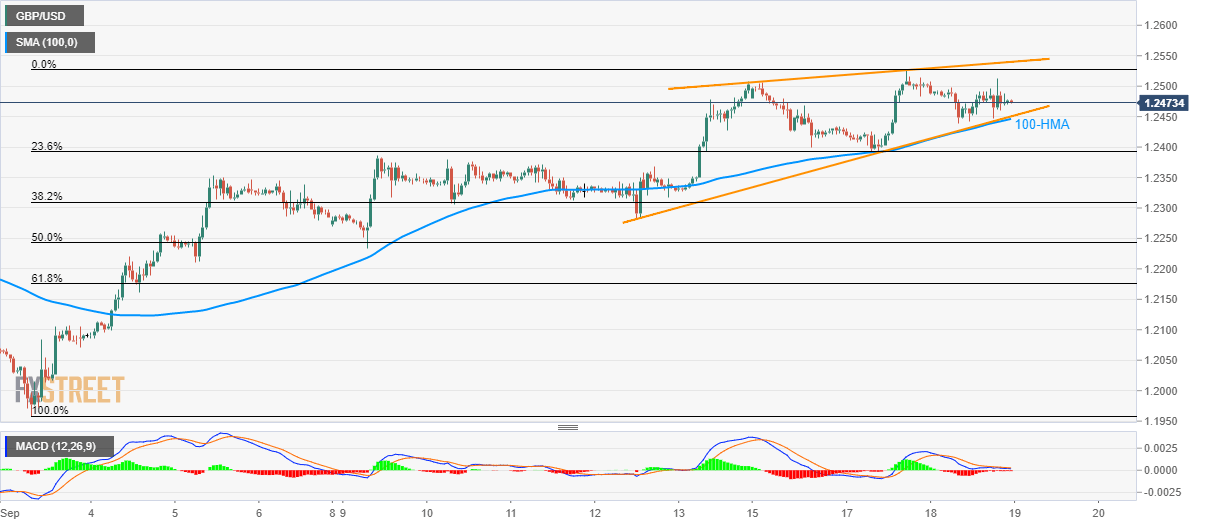
- 100-HMA adds strength to the formation’s support line.
GBP/USD portrays a short-term rising wedge bearish formation while trading near 1.2475 during the Asian session on Thursday.
The 12-bar moving average convergence and divergence (MACD) signals lack of the momentum inside the key technical pattern, indicating brighter chances of a breakout.
With the bearish pattern surrounding monthly top, bulls are quite concerned about the pair’s downside break of 1.2450/45 area, including 100-hour simple moving average (HMA) and formation support, as it will confirm the bearish play towards early last-week highs surrounding 1.2380 and then to September 12 low near 1.2280.
During the pair’s declines below 1.2280, 50% and 61.8% Fibonacci retracement levels of current month upside around 1.2240 and 1.2175 could lure the bears.
Meanwhile, 1.2510 and latest high close to 1.2530 can please near-term buyers prior to challenging them with a four-day-old rising trend-line, at 1.2540 now.
GBP/USD hourly chart
Trend: pullback expected
