Home GBP/USD Technical Analysis: Rising Wedge rejects 1.3200 figure – Bullish advance might take a small breather
FXStreet News

GBP/USD Technical Analysis: Rising Wedge rejects 1.3200 figure – Bullish advance might take a small breather

  • GBP/USD main bear trend has been on hold since mid-August.  
  • GBP/USD is breaking to the downside from the rising wedge pattern after rejecting the 1.3200 figure. The RSI, the MACD and the Stochastics indicators are decelerating, all suggesting that the current bull leg might be setting up for a correction in the near-term.  
  • Level of supports are seen near 1.3050 and 1.3000 figure.  

GBP/USD 4-hour chart  
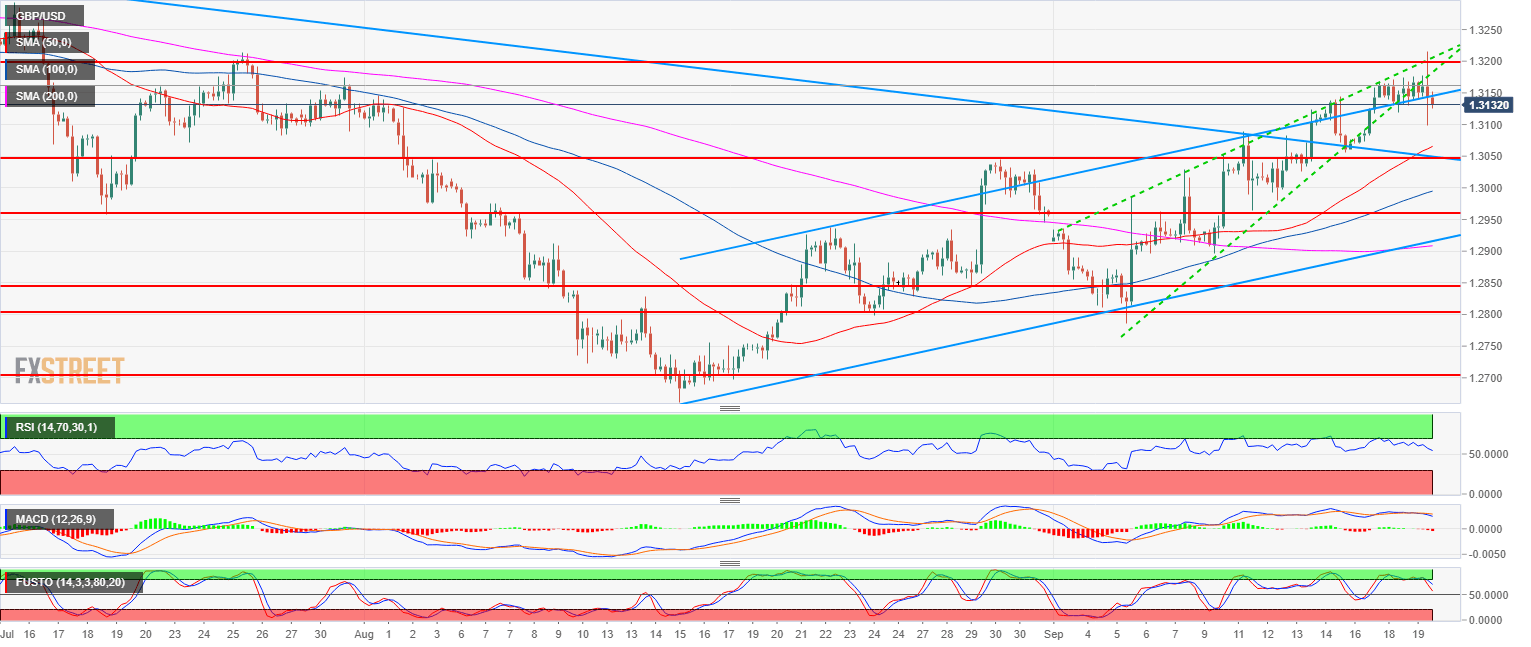
Spot rate:                    1.3135
Relative change:          -0.08%      
High:                           1.3215
Low:                            1.3098

Main trend:                 Bearish  

Resistance 1:             1.3144 last week high
Resistance 2:             1.3200 figure (key support/resistance)
Resistance 3:             1.3300 figure
Resistance 4:             1.3472 June 7 high

Support 1:                  1.3082-1.3100 supply/demand level and figure
Support 2:                  1.3050 August 30 swing high, key level
Support 3:                  1.3000 figure

FX Street

FX Street

FXStreet is the leading independent portal dedicated to the Foreign Exchange (Forex) market. It was launched in 2000 and the portal has always been proud of their unyielding commitment to provide objective and unbiased information, to enable their users to take better and more confident decisions.