- Short-term key resistances keep GBP/USD under pressure.
- 1.2080 holds the gate for pair’s drop towards 1.2000 round-figure.
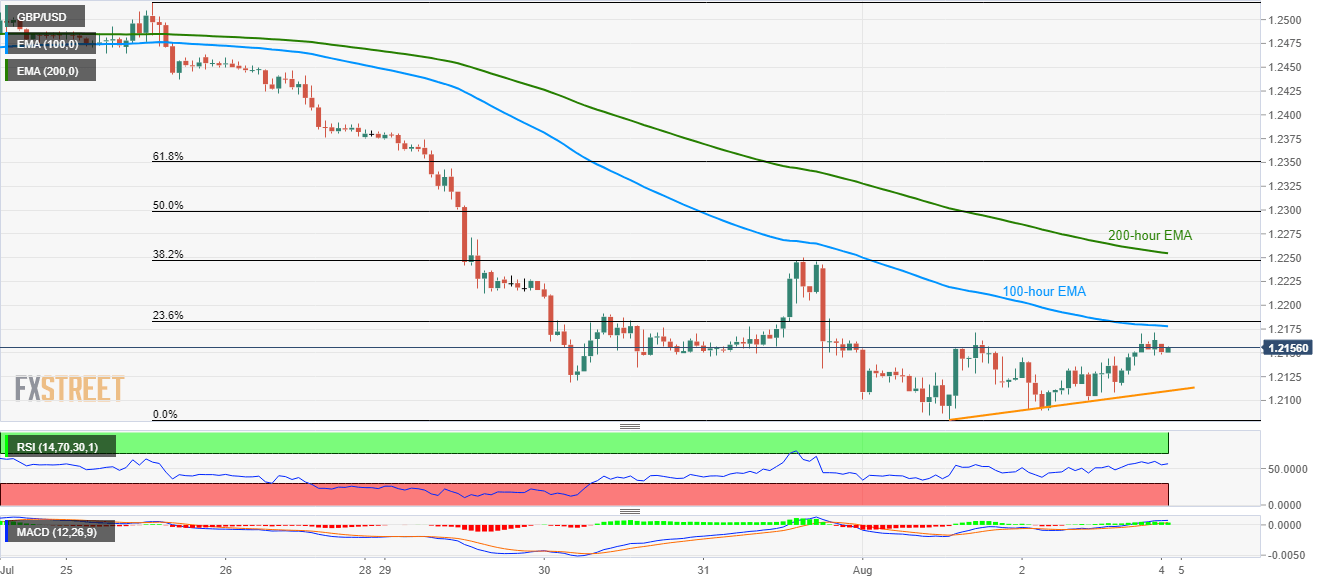
Repeated failures to rise beyond key short-term resistances keep GBP/USD moves under pressure while the pair takes the rounds to 1.2155 during the early Asian session on Monday.
100-hour exponential moving average (EMA) at 1.2178, followed by 23.6% Fibonacci retracement of the latest downpour from July 25 high near 1.2183, seems immediate upside barriers for pair traders to watch.
Should prices manage to clear 1.2183, 38.2% Fibonacci retracement and 200-hour EMA, around 1.2247 and 1.2255 respectively, will flash on buyers’ radar.
On the downside, 1.2120 and a two-day-old ascending trend-line at 1.2110 holds the gate for the pair’s plunge to latest low surrounding 1.2080.
In a case where bears dominate past-1.2080, 1.2000 psychological magnet will appear as their target.
GBP/USD hourly chart
Trend: Bearish
