- GBP/USD stays below the short-term key resistance line despite witnessing a gap-up opening.
- The one-week-old rising trend line can act as immediate support while 1.3000 could keep luring buyers.
With the GBP/USD buyers’ failure to cross nearly a one-month-old falling trend line, a short-term rising support line gains market attention. The quote seesaws near 1.2917 during the early Asian session on Monday.
Considering the fundamentals, today’s speech from the United Kingdom (UK) Prime Minister (PM) Boris Johnson is likely to offer another upside push to the cable after recently positive sentiment favored the pair’s run-up.
Read: UK PM Johnson will pledge an end to Brexit uncertainty at CBI event later on Monday
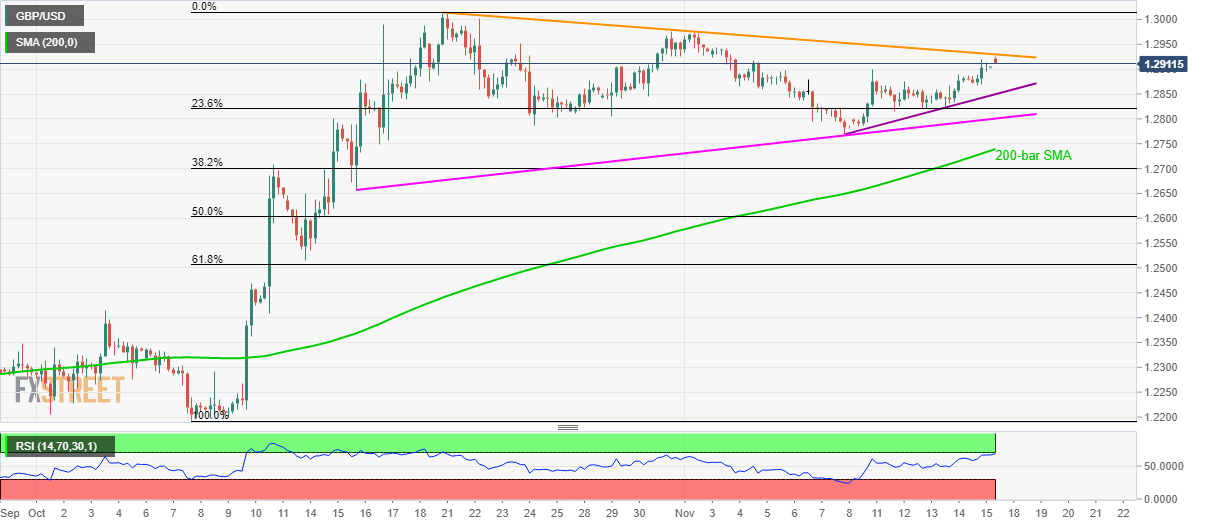
Technically, a week-long ascending trend line, at 1.2850, will be the immediate concern for sellers ahead of an upward sloping trend line since mid-October, around 1.2800, followed by 200-bar Simple Moving Average (SMA) level of 1.2740.
In a case prices decline below 1.2740, bears will target 1.2700 and October 14 low at 1.2515.
On the contrary, 1.3000 and the previous month high around 1.3015 can question bulls even if they manage to cross the aforementioned resistance line at 1.2930. Also doubting the pair’s upside is overbought conditions of 14-bar Relative Strength Index (RSI).
GBP/USD 4-hour chart
Trend: Pullback expected
