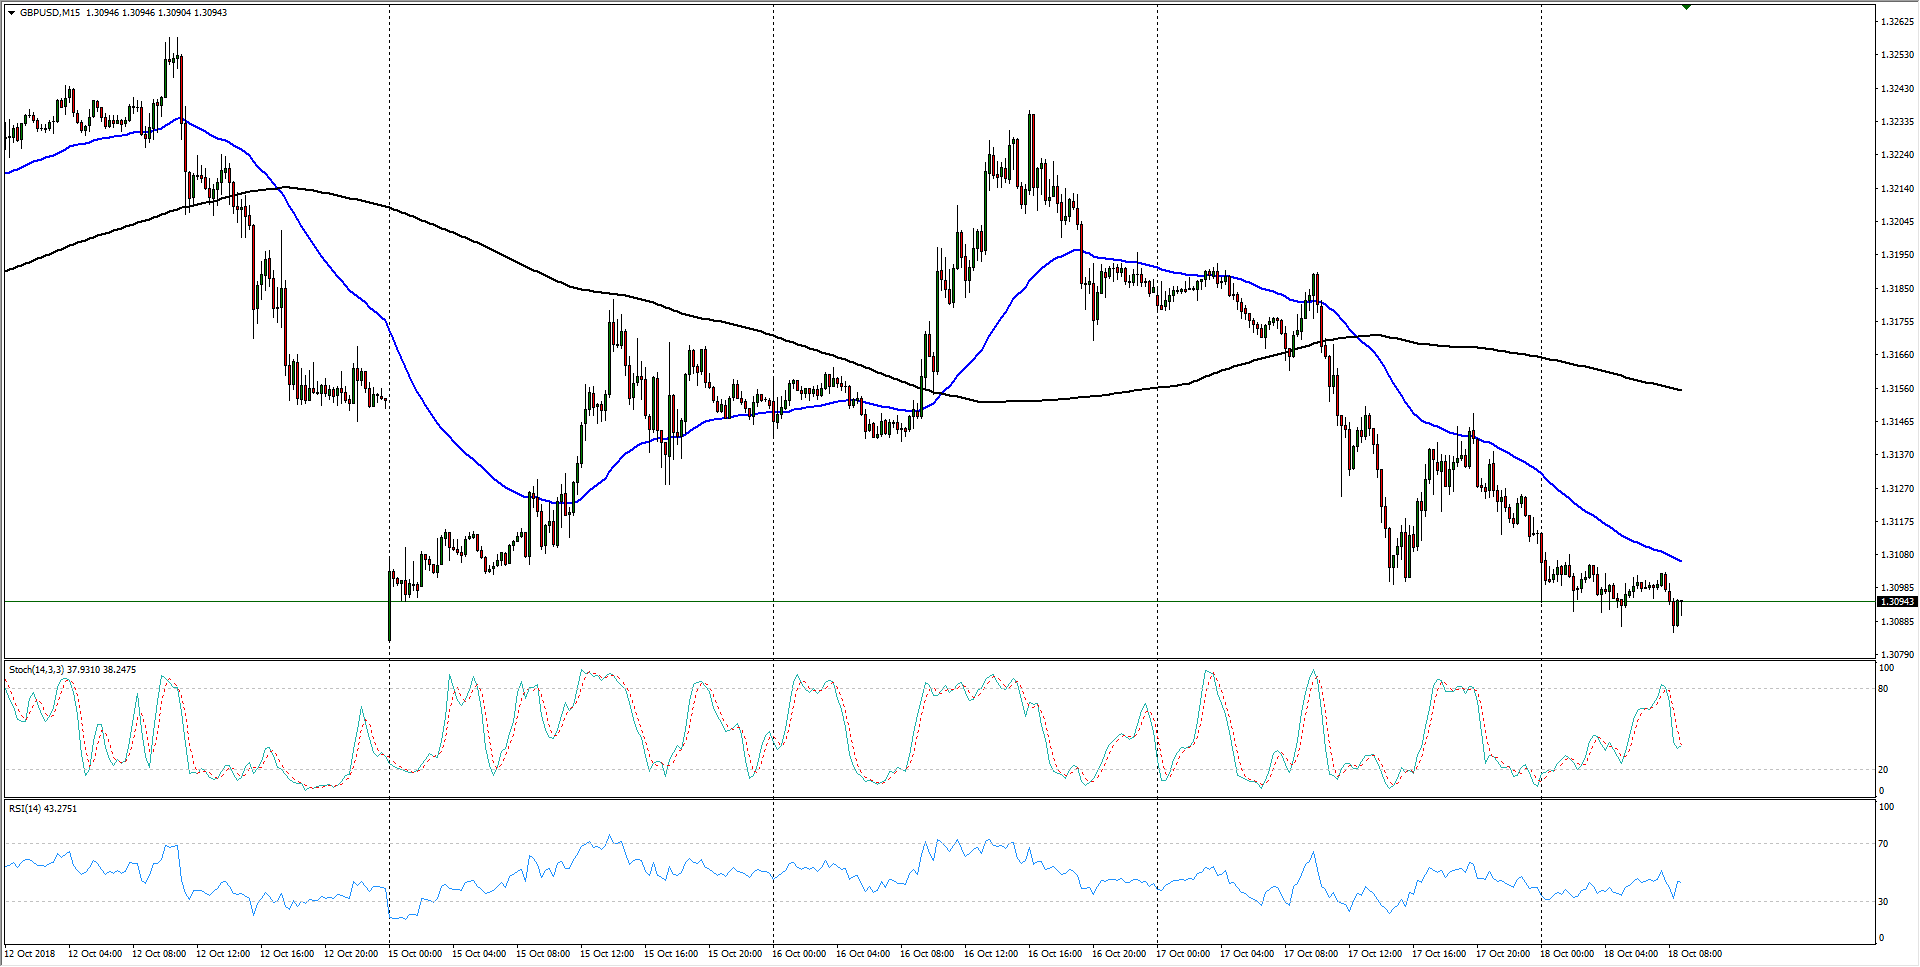
- The GBP/USD is shifting into the downside just south of 1.3100 as the Sterling continues to weaken against the USD.
- Hourly candles show the pair has broken below the 200-hour moving average, and the Cable is now challenging the week’s bottom at 1.3083.
- 1-Hour technical indicators are pinning into oversold territory, and the Cable could be primed for a hop back up to the 200-hour moving average at 1.3150 before continuing lower.
GBP/USD
Overview:
Last Price: 1.3095
Daily change: -21 pips
Daily change: -0.160%
Daily Open: 1.3116
Trends:
Daily SMA20: 1.3114
Daily SMA50: 1.2995
Daily SMA100: 1.3097
Daily SMA200: 1.3485
Levels:
Daily High: 1.3194
Daily Low: 1.3099
Weekly High: 1.326
Weekly Low: 1.3028
Monthly High: 1.33
Monthly Low: 1.2922
Daily Fibonacci 38.2%: 1.3136
Daily Fibonacci 61.8%: 1.3158
Daily Pivot Point S1: 1.3078
Daily Pivot Point S2: 1.3041
Daily Pivot Point S3: 1.2983
Daily Pivot Point R1: 1.3174
Daily Pivot Point R2: 1.3232
Daily Pivot Point R3: 1.3269
