- GBP/USD on the back foot below 61.8% Fibonacci retracement after breaking short-term rising trend-line.
- August 27 high challenges bearish MACD signal.
Having breached one-week-old rising trend-line, the GBP/USD pair declines below 61.8% Fibonacci retracement level of July-September downpour as it flashes 1.2330 quote on the chart during early Thursday.
Not only the break of immediate support (now resistance) but bearish signal by the 12-bar moving average convergence and divergence (MACD) also favors the sellers awaiting pair’s sustained dip below August 22 high surrounding 1.2310.
In doing so, 50% Fibonacci Retracement level of 1.2270 and early August tops close to 1.2210 become bears’ favorites.
Should prices regain their stand beyond 61.8% Fibonacci retracement level of 1.2345, a break above current month high nearing 1.2385 will be searched to target July 23 low close to 1.2425.
GBP/USD 4-hour chart
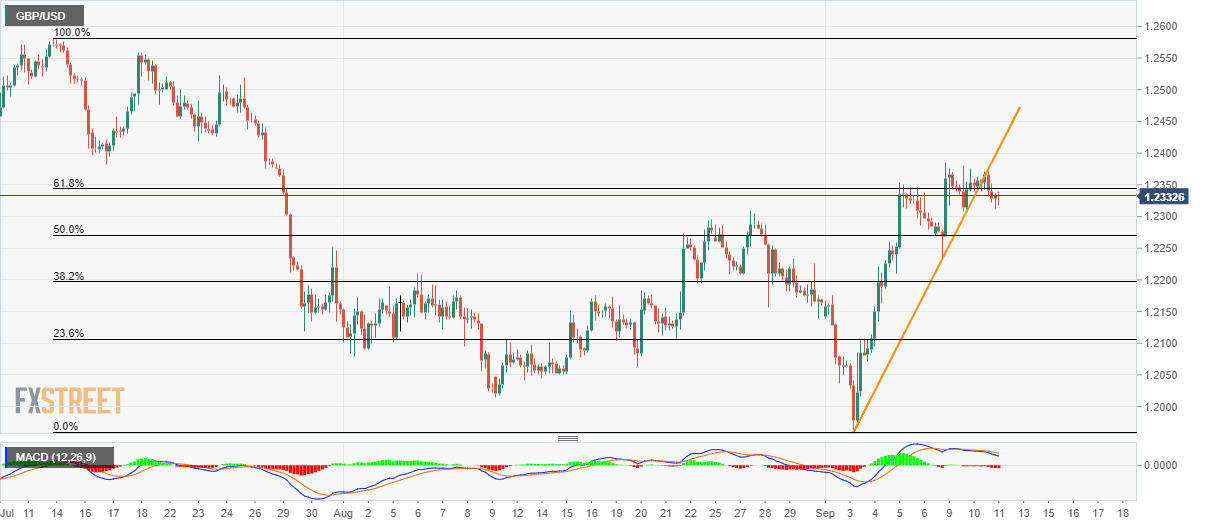
Trend: pullback expected
