- GBP/USD is consolidating last week gains as the market trades near the 1.2141 resistance.
- The levels to beat for bears are the 1.2122 and 1.2097 levels.
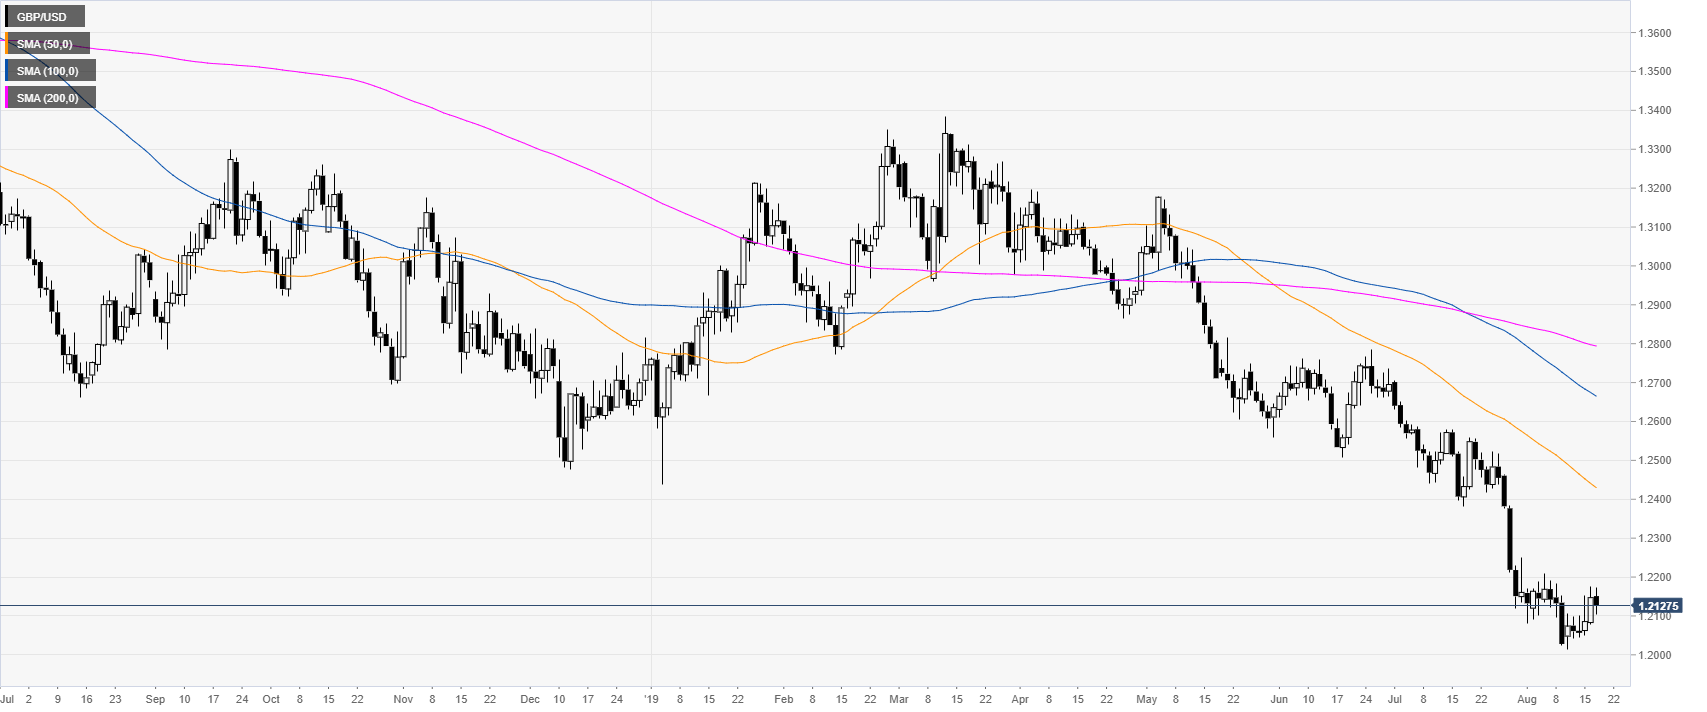
GBP/USD daily chart
The Cable is trading in a bear trend below its main daily simple moving averages (SMAs). The market is consolidating last week modest advance.
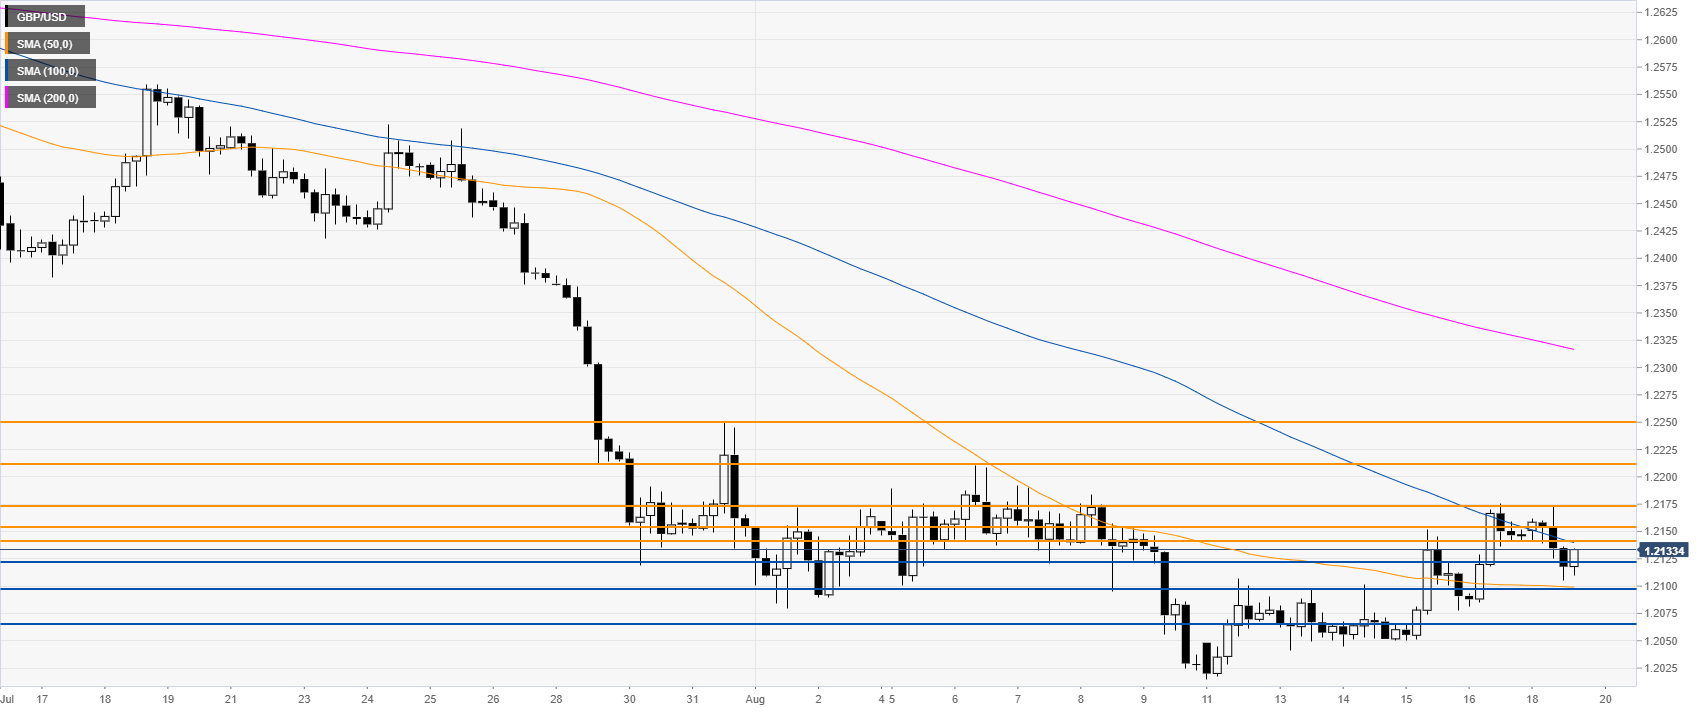
GBP/USD 4-hour chart
GBP/USD is trading below 1.2141 resistance and the 100/200 SMAs suggesting a bearish bias in the medium term. The levels to beat for bears are 1.2122, followed by 1.2097 and 1.2065, according to the Technical Confluences Indicator.
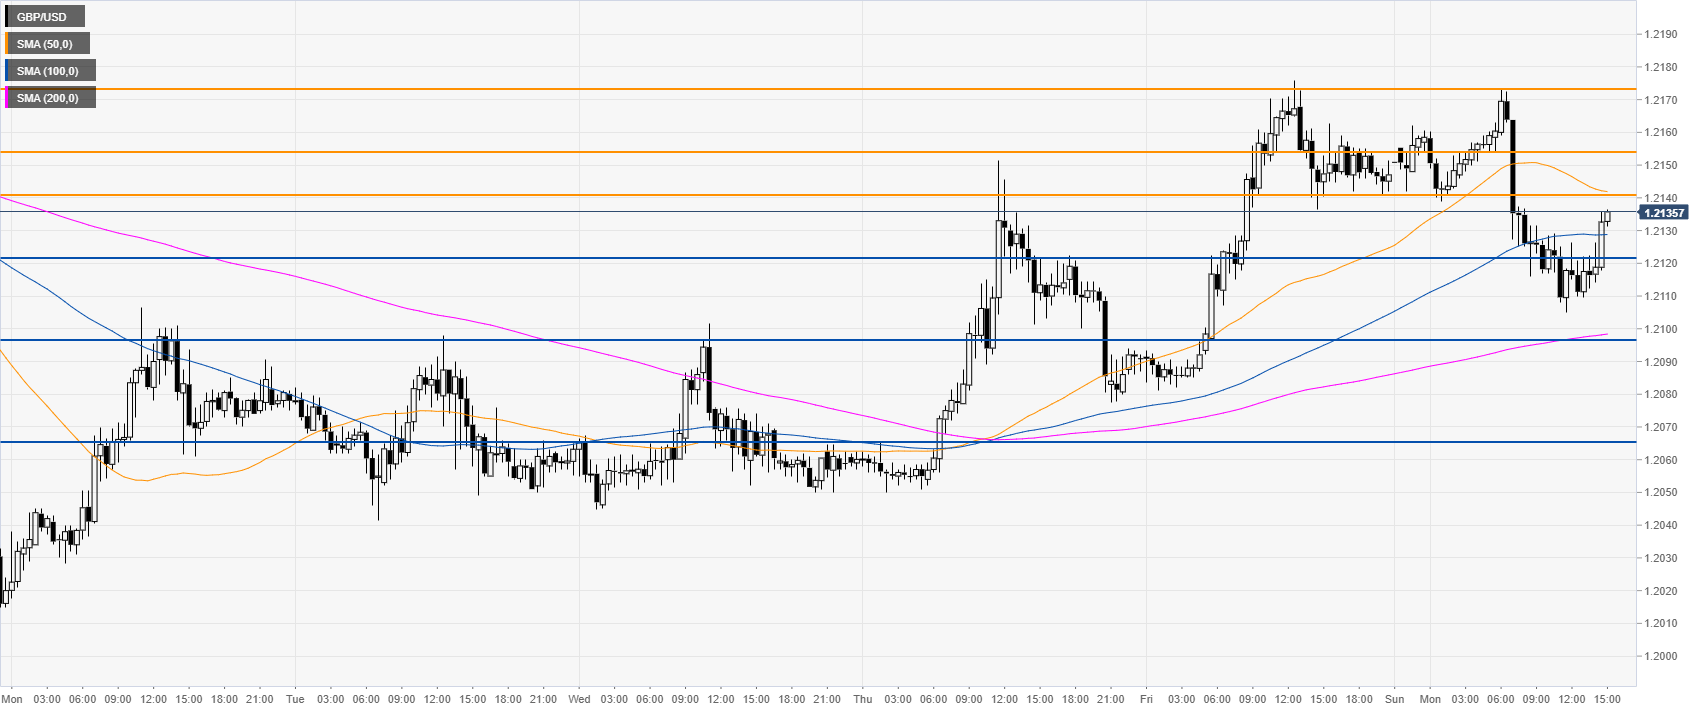
GBP/USD 30-minute chart
GBP/USD is losing steam on Monday. Immediate resistances are seen at 1.2141, 1.2154 and the 1.2173 level, according to the Technical Confluences Indicator.
Additional key levels
