“¢ The pair caught some bids during the early European session and jumped to fresh session tops in the last hour, albeit lacked any strong follow-through.
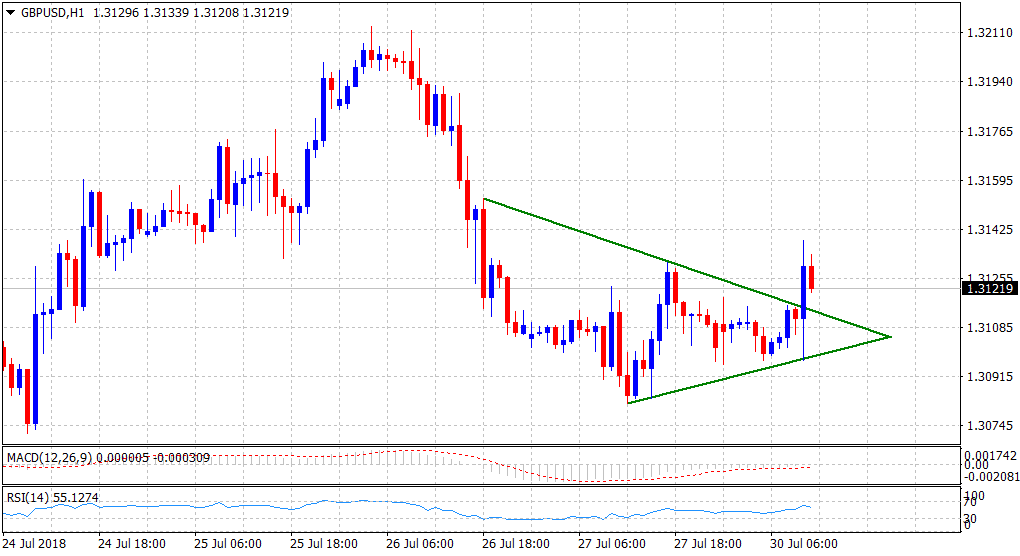
“¢ The latest leg of a sharp spike lacked any obvious catalyst and could be attributed to some technical buying above a descending trend-line, visible on the shorter timeframe.
“¢ The trend-line constituted towards the formation of a symmetrical triangle on the 1-hourly chart and hence, might have negated any near-term bearish outlook.
Spot rate: 1.3122
Daily High: 1.3139
Daily Low: 1.3096
Trend: Intraday bullish
Resistance
R1: 1.3138 (100-period SMA H1)
R2: 1.3180 (R3 daily pivot-point)
R3: 1.3213 (last Thursday’s swing high)
Support
S1: 1.3096 (current day swing low)
S2: 1.3056 (S2 daily pivot-point)
S3: 1.3015-10 (horizontal zone)
