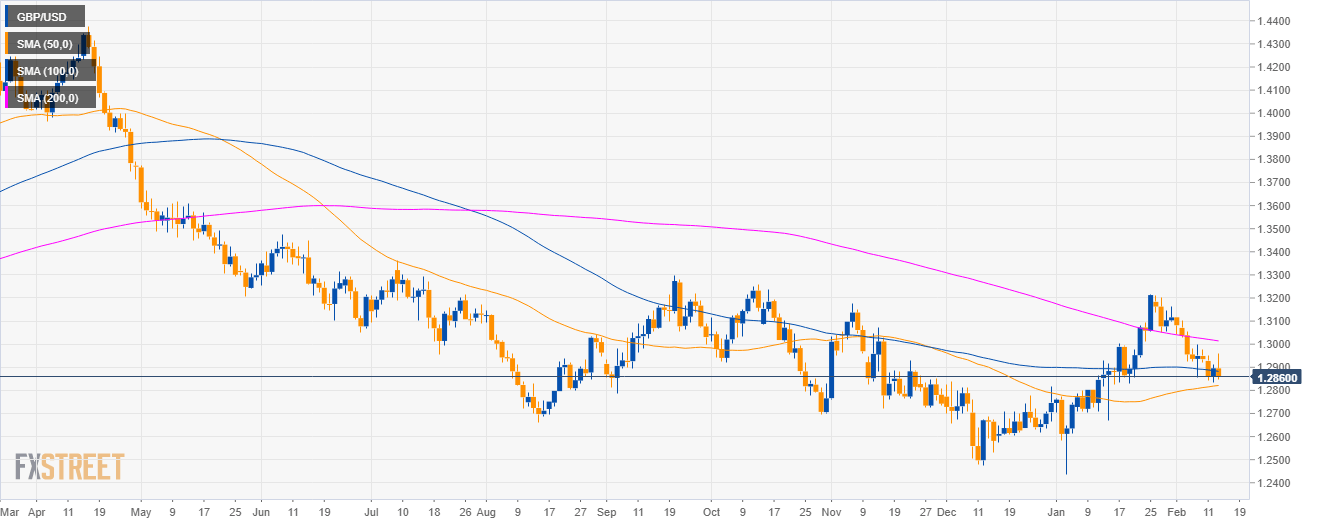
GBP/USD daily chart
- GBP/USD is trading in a bear trend below the 200-day simple moving average (SMA).
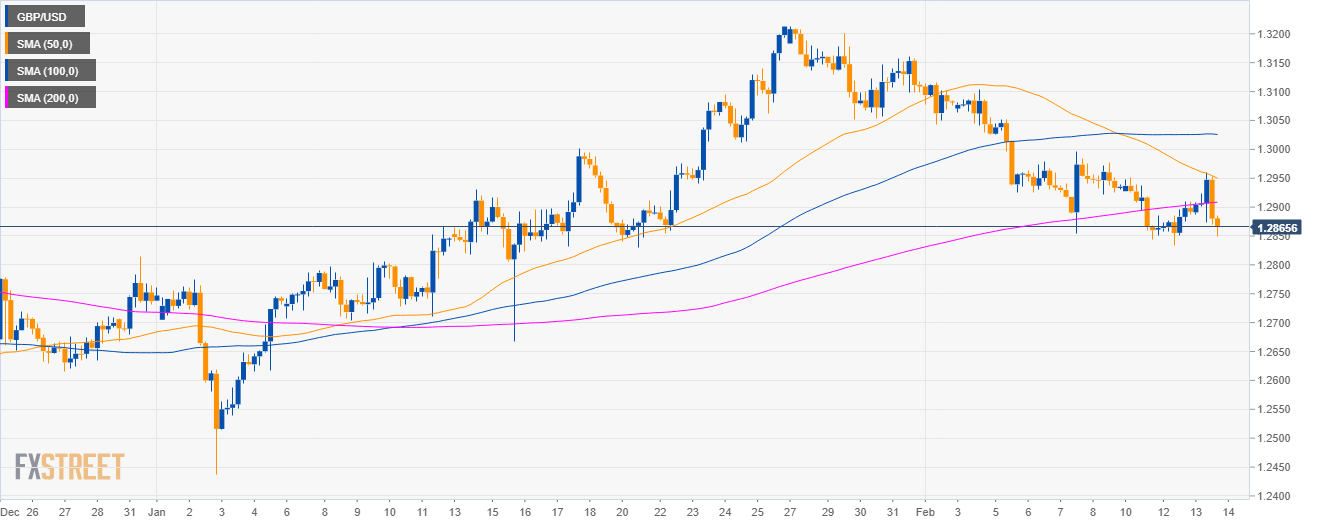
GBP/USD 4-hour chart
- GBP/USD is trading below its main SMAs suggesting bearish momentum in the medium-term.
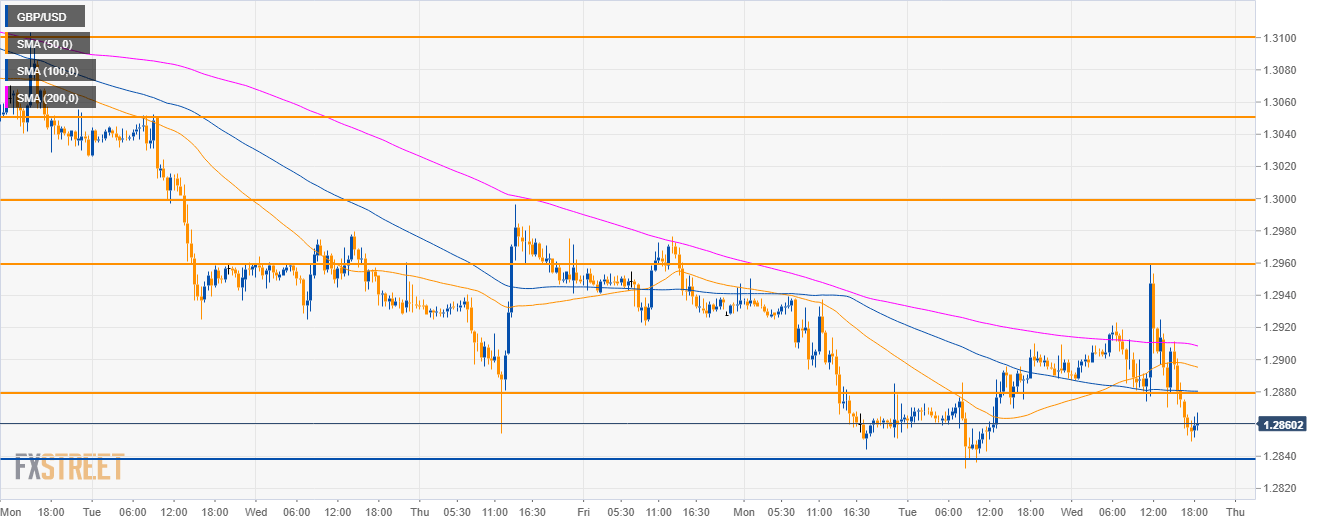
GBP/USD 30-minute chart
- GBP/USD is trading below the main SMAs suggesting a bearish bias. However, GBP/USD has been ranging for the last 5 days, which suggests a sideways market in the short-term.
- To the downside, support is seen at 1.2840 and 1.2800 figure.
- Bulls have to break above 1.2880 to reach 1.2960 figure to the upside.
Additional key levels
GBP/USD
Overview:
Today Last Price: 1.2862
Today Daily change: -34 pips
Today Daily change %: -0.26%
Today Daily Open: 1.2896
Trends:
Daily SMA20: 1.3002
Daily SMA50: 1.2819
Daily SMA100: 1.2885
Daily SMA200: 1.3017
Levels:
Previous Daily High: 1.291
Previous Daily Low: 1.2833
Previous Weekly High: 1.3103
Previous Weekly Low: 1.2854
Previous Monthly High: 1.3214
Previous Monthly Low: 1.2438
Daily Fibonacci 38.2%: 1.288
Daily Fibonacci 61.8%: 1.2862
Daily Pivot Point S1: 1.2849
Daily Pivot Point S2: 1.2802
Daily Pivot Point S3: 1.2771
Daily Pivot Point R1: 1.2926
Daily Pivot Point R2: 1.2957
Daily Pivot Point R3: 1.3003
