- Descending trend-line from mid-February question bears targeting December bottom and YTD lows amid oversold RSI.
- 21-DMA acts as immediate resistance to watch during the pullback.
Despite trading near yearly lows, a 4-month old descending support-line limits the GBP/USD pair’s immediate declines as it trades near 1.2535 ahead of the UK open on Tuesday.
In addition to a downward sloping trend-line from mid-February, at 1.2525, oversold levels of 14-day relative strength index (RSI) also signal brighter chances of its pullback to 1.2580 and then to 1.2660 resistances.
Further, the break of 1.2660 enables the pair’s rally to 21-day simple moving average (SMA) level near 1.2660 and the month’s high surrounding 1.2765.
Given the bears dominate price sentiment and drag the quote under 1.2525 on a daily closing basis, December 2018 low near 1.2477 and the current year bottom around 1.2438 could flash on their radars.
GBP/USD daily chart
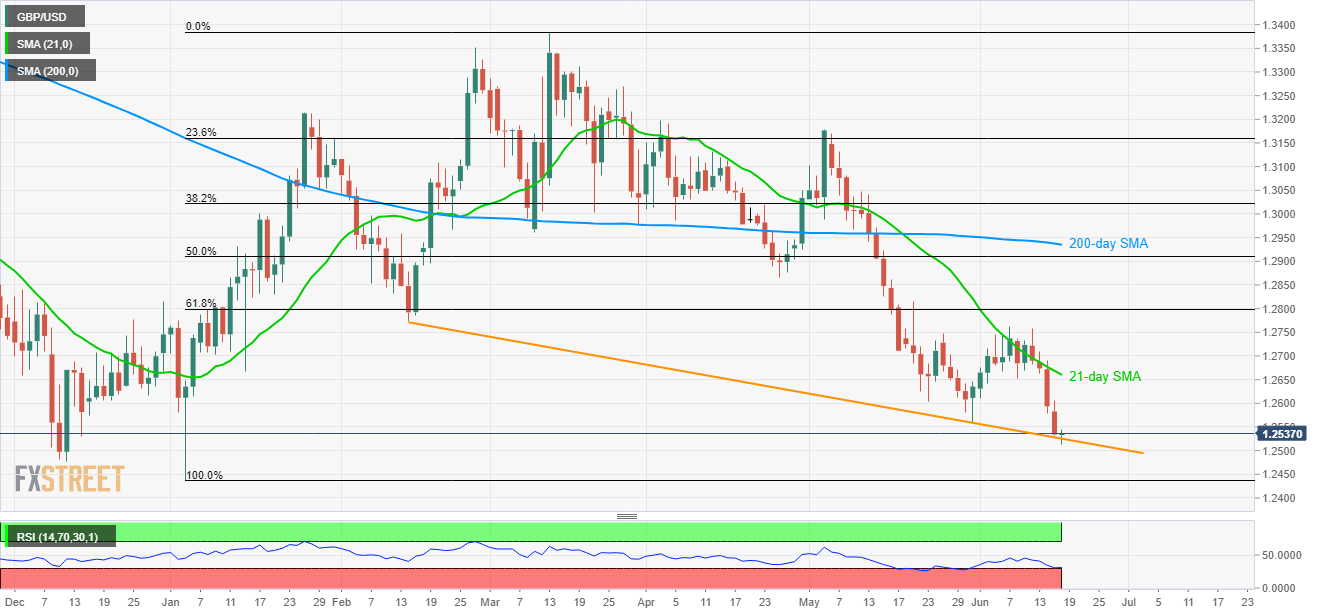
Trend: Pullback expected
