- GBP/USD traders near the lowest in one week.
- Nearly oversold RSI conditions, 23.6% Fibonacci retracement also contribute to challenging the sellers.
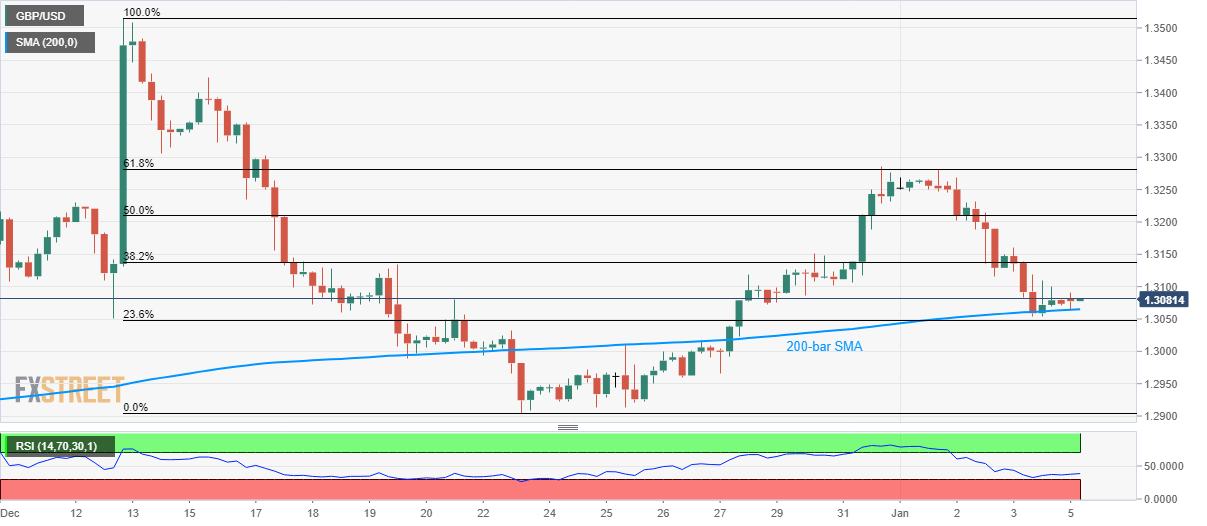
- Buyers will wait for entry unless prices cross 61.8% Fibonacci retracement.
GBP/USD trades modestly changed near 1.3085 during the Asian session on Monday. The pair declined heavily during the later part of the last week. Even so, it fails to slip below 200-bar SMA.
Considering the pair’s failure to slip below the key SMA and 23.6% Fibonacci retracement of December 12/23 fall, not to forget nearly oversold RSI, the quote is likely to witness a pullback.
In doing so, 1.3155 and 50% Fibonacci retracement level of 1.3210 can entertain buyers ahead of pushing them to 61.8% Fibonacci level of 1.3282.
However, pair’s strong run-up towards the previous month high of 1.3515 can only be expected if it manages to successfully cross 1.3282.
Meanwhile, a downside break of 200-bar SMA level of 1.3065 needs validation from 23.6% Fibonacci retracement level of 1.3048 in order to visit 1.3000.
Also, pair’s further declines below 1.3000 can take rest on the two-month-old rising trend line near 1.2955/50.
GBP/USD daily chart
Trend: Bearish
