- GBP/USD tests near-term rising trend-line after repeated failures to clear 50% Fibonacci retracement.
- MACD portrays exhaustion of bullish sentiment.
Having failed to cross 50% Fibonacci retracement of June-September declines, GBP/USD tests one-week-old ascending support-line as it trades near 1.2360 during Wednesday’s Asian session.
In addition to a pullback from immediate resistance, 50% Fibonacci retracement, bearish signal by the 12-bar moving average convergence and divergence (MACD) also increases the odds for the pair’s fresh drop if it slips below 1.2340 trend-line support.
In doing so, August 27 high of 1.2310 and early August top close to 1.2210 could become sellers’ favorites.
Alternatively, pair’s run-up beyond 1.2371 resistance has multiple upside barriers, namely July 17 low of 1.2382 and July 24 bottom close to 1.2420, to cross in order to justify its strength to challenge 61.8% Fibonacci retracement level of 1.2467.
GBP/USD 4-hour chart
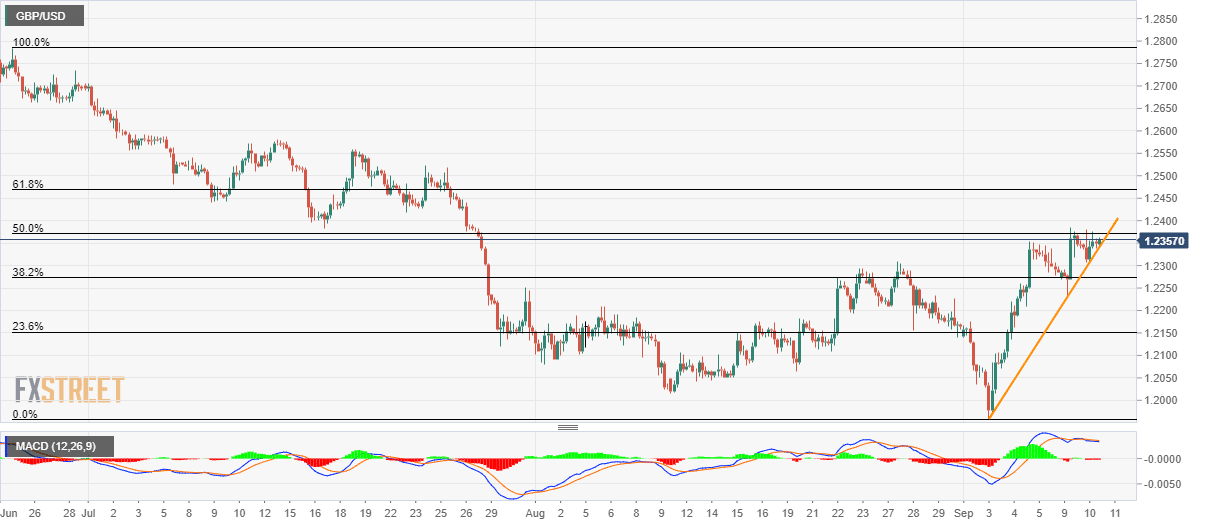
Trend: pullback expected
