- The Sterling might be losing steam as 1.2360 is a tough nut to crack.
- Support is seen at 1.2315 and 1.2270 price levels, according to the Technical Confluences Indicator.
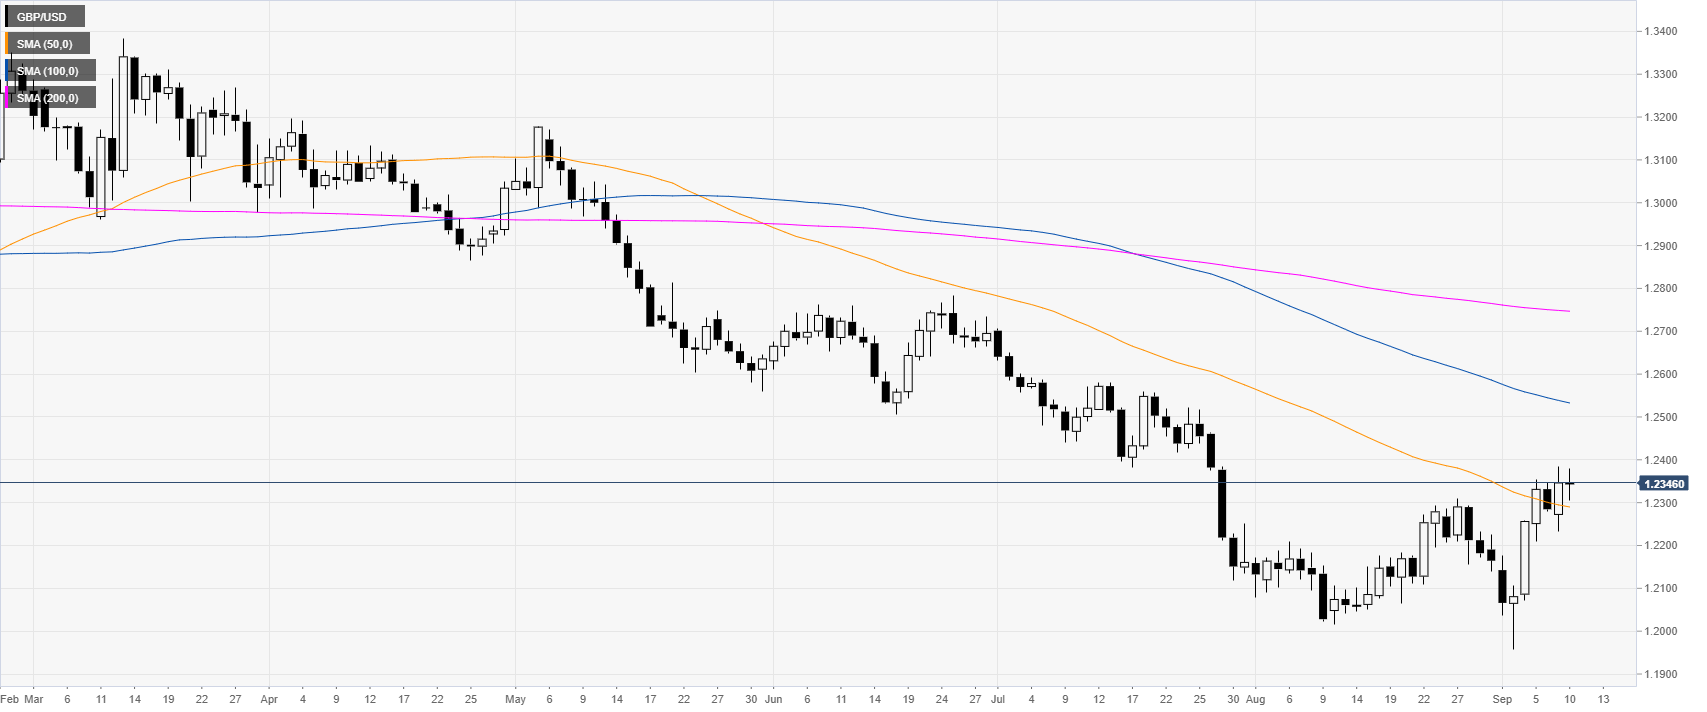
GBP/USD daily chart
The Sterling is trading in a bear trend below the 100 and 200-day simple moving averages (SMAs). However, GBP/USD is attempting to create a double bottom with the August lows as the market is parked below the 1.2400 figure.
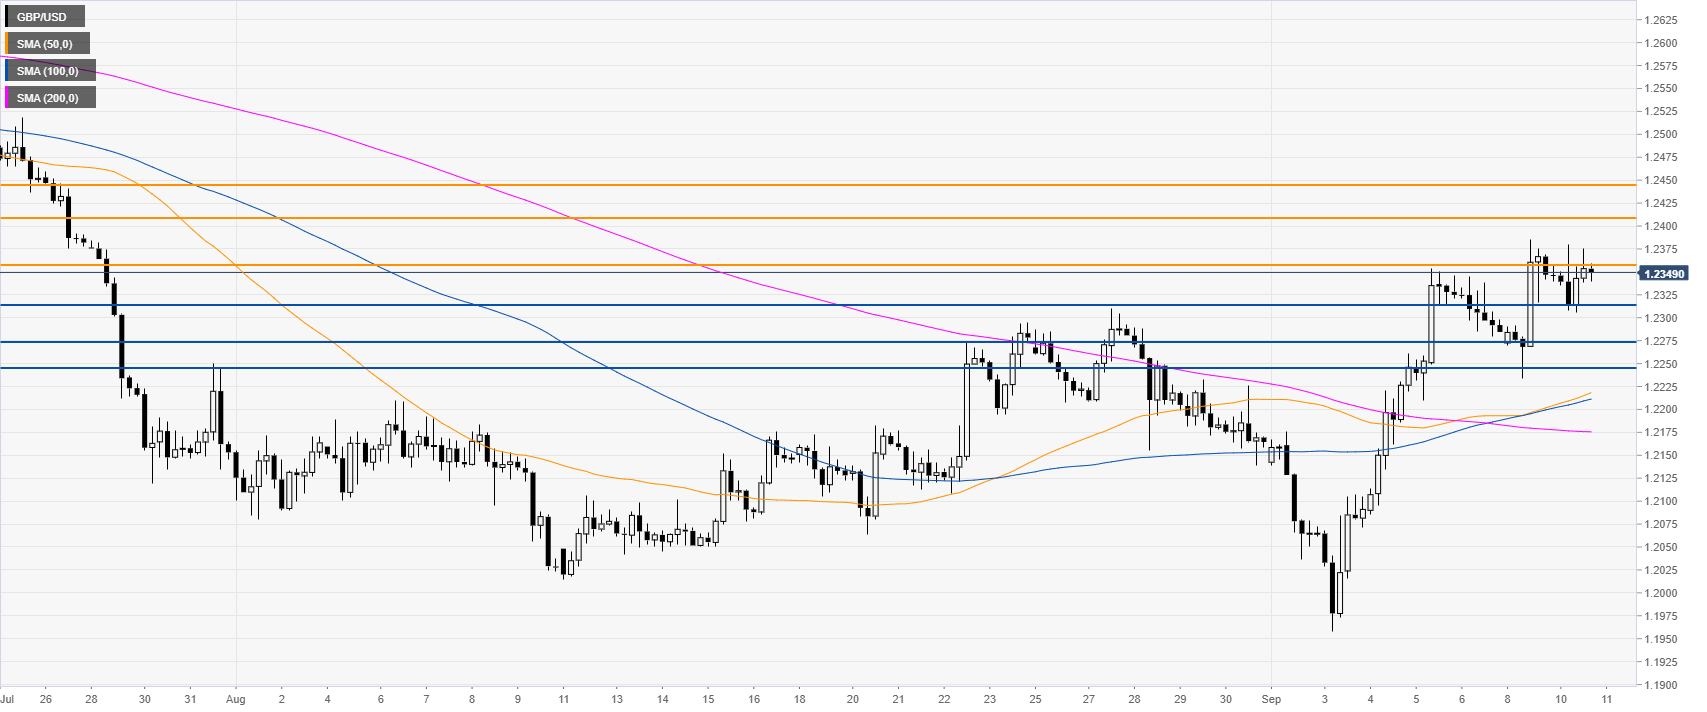
GBP/USD four-hour chart
GBP/USD is trying to break above 1.2360 resistance. Bulls have been trying their luck repeatedly over the last three days. A break beyond this level can expose the 1.2411 and 1.2450 resistances, according to the Technical Confluences Indicator.
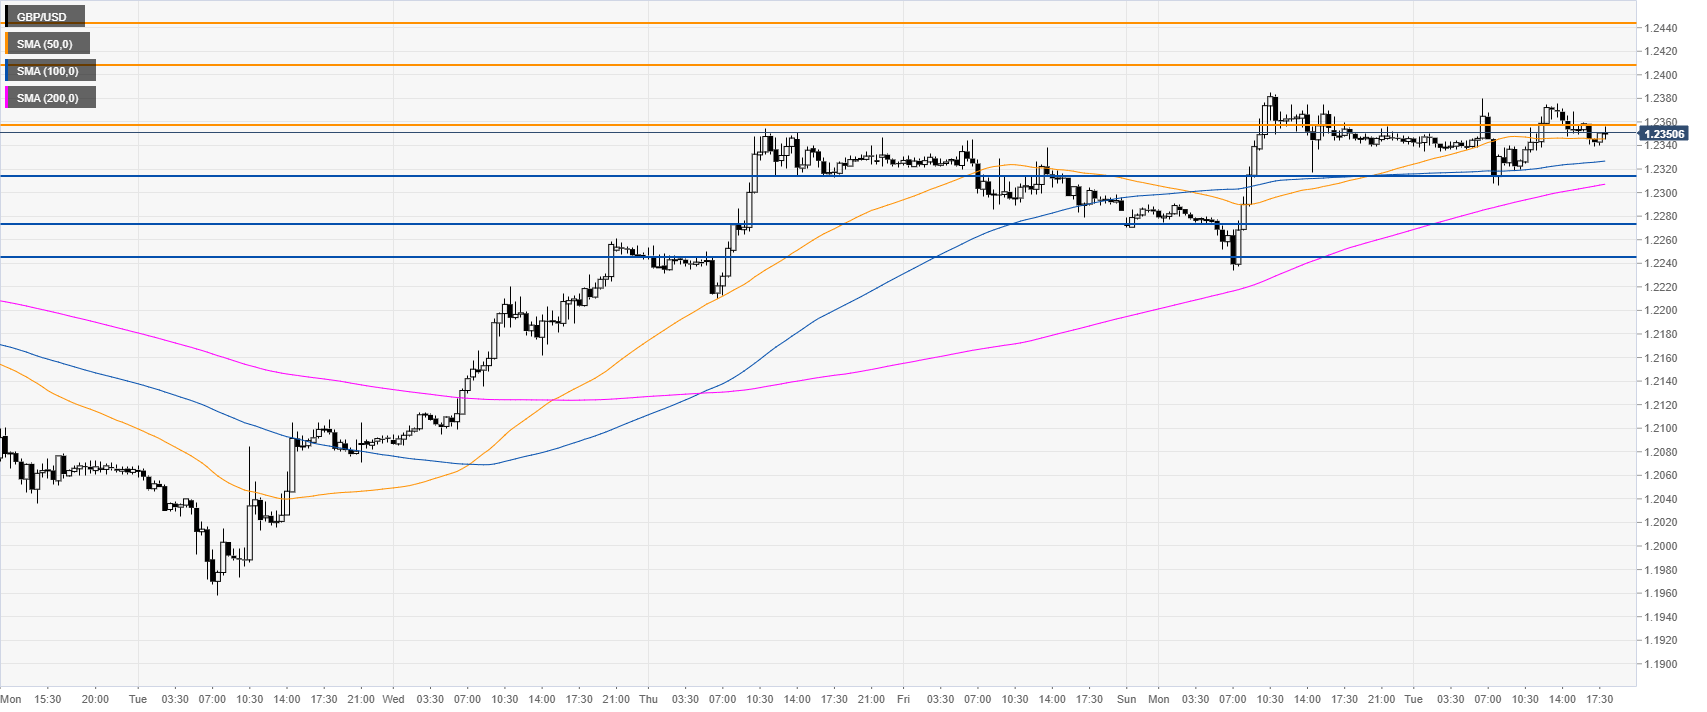
GBP/USD 30-minute chart
The Pound is trading above the main SMAs, suggesting bullish momentum in the near term. Bears need to reclaim the 1.2315 support to create a pullback down towards 1.2270 and 1.2244 support, according to the Technical Confluences Indicator.
Additional key levels
