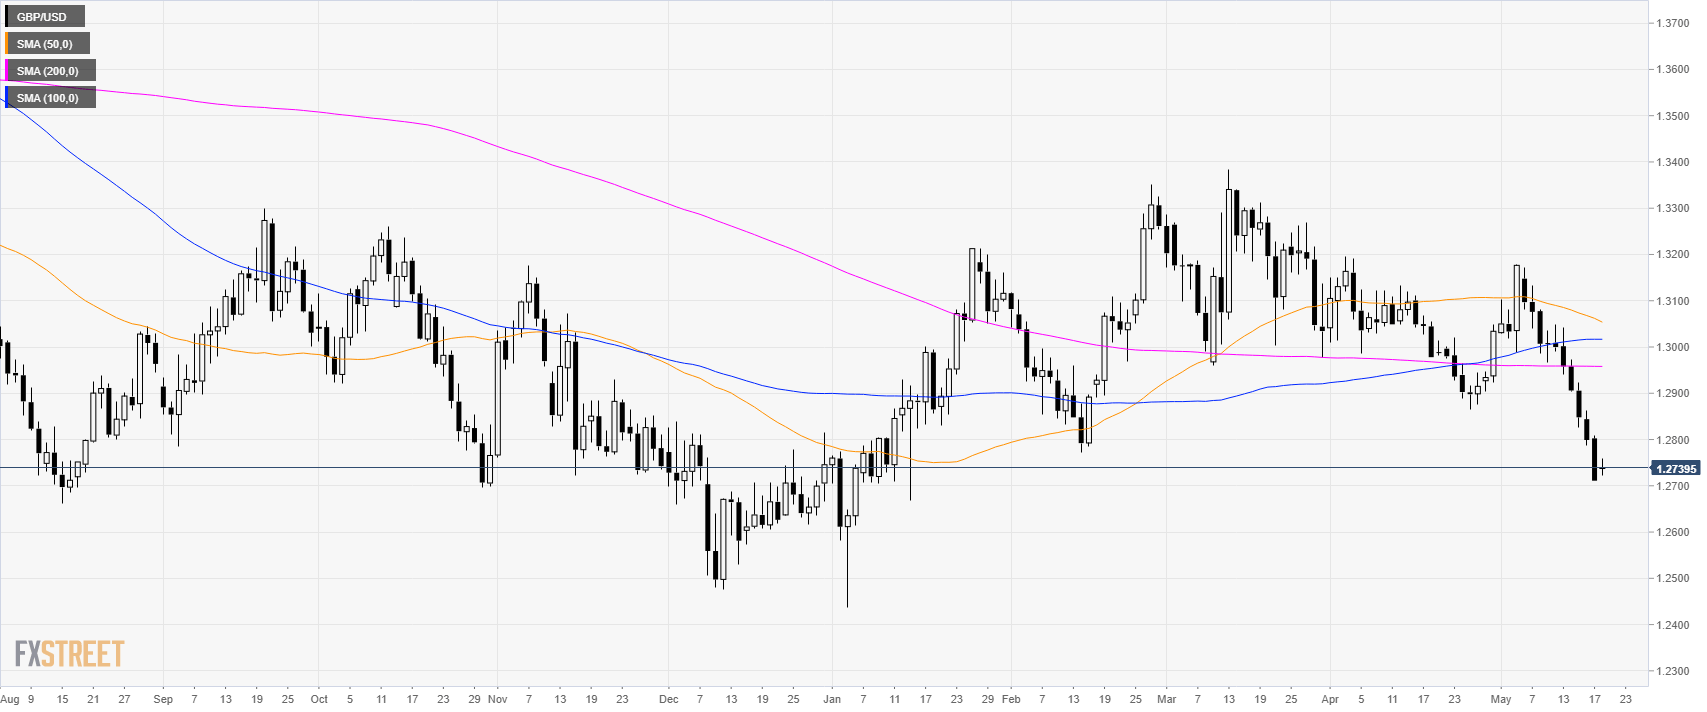
GBP/USD daily chart
GBP/USD has been trading steeply down in the last two weeks. The major supports to the downside are seen at 1.2700 figure, 1.2670 swing low and 1.2550 figure.
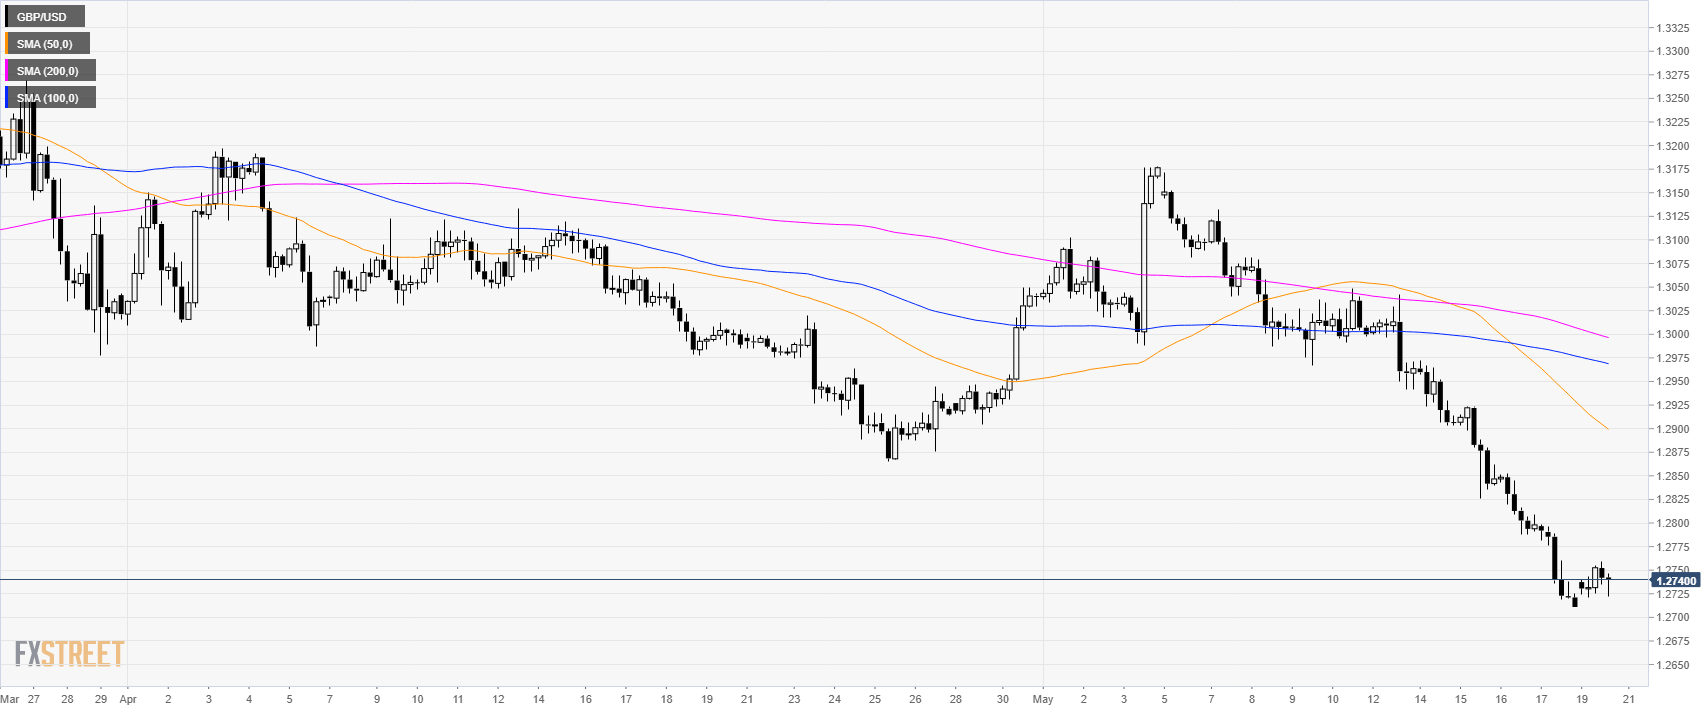
GBP/USD 4-hour chart
GBP/USD is below its main SMAs.
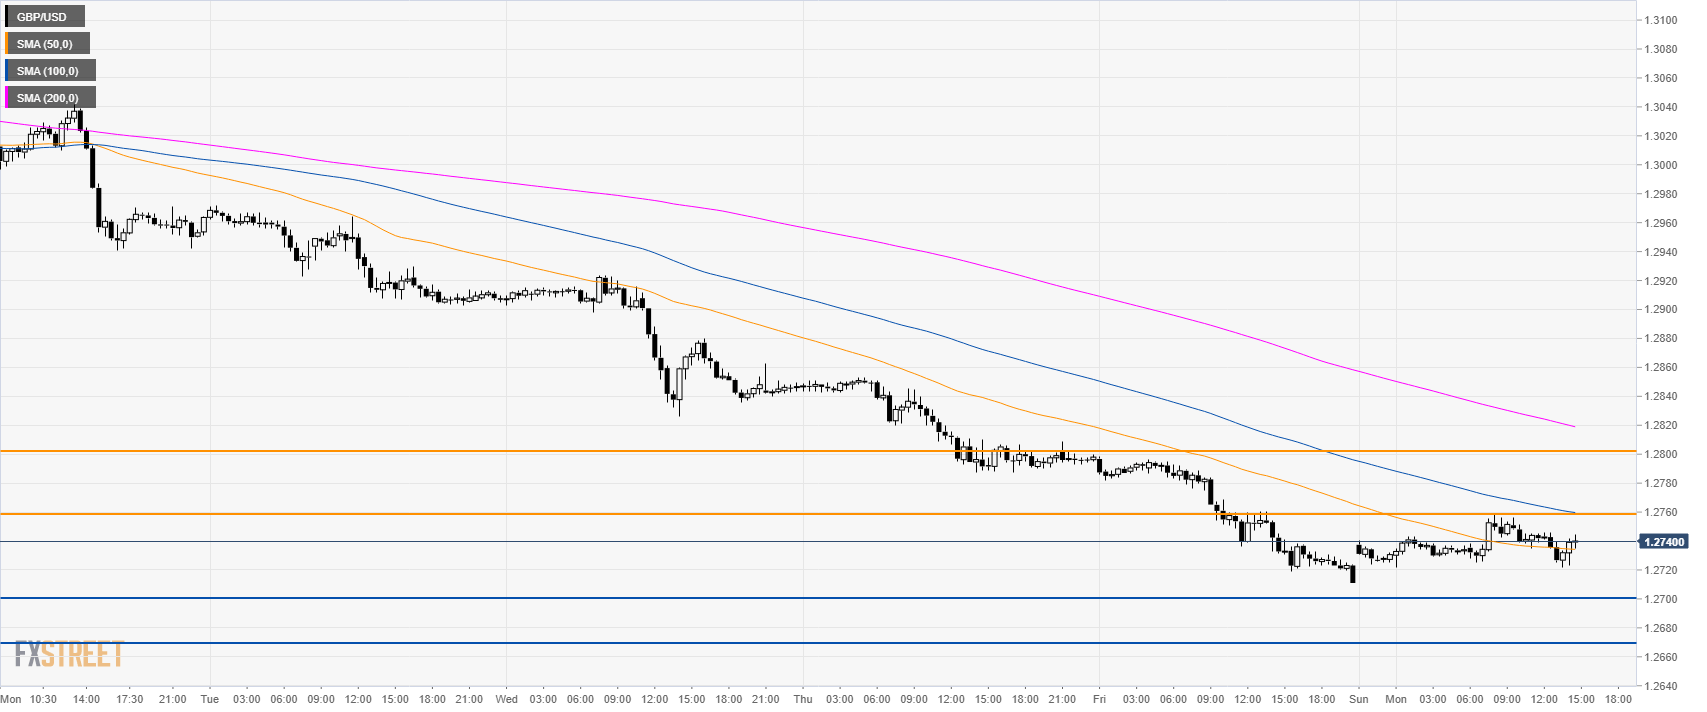
GBP/USD 30-minute chart
GBP/USD is currently consolidating above the 1.2700 figure. Cable is trading below its 100 and 200 SMA while above the 50 SMA. It is unclear if the bears will give it another go to the downside or if the market will be stabilizing above 1.2700. A recovery would put 1.2760 to the test followed by 1.2800 figure. Supports are at 1.2700 and 1.2670 levels.
Additional key levels
