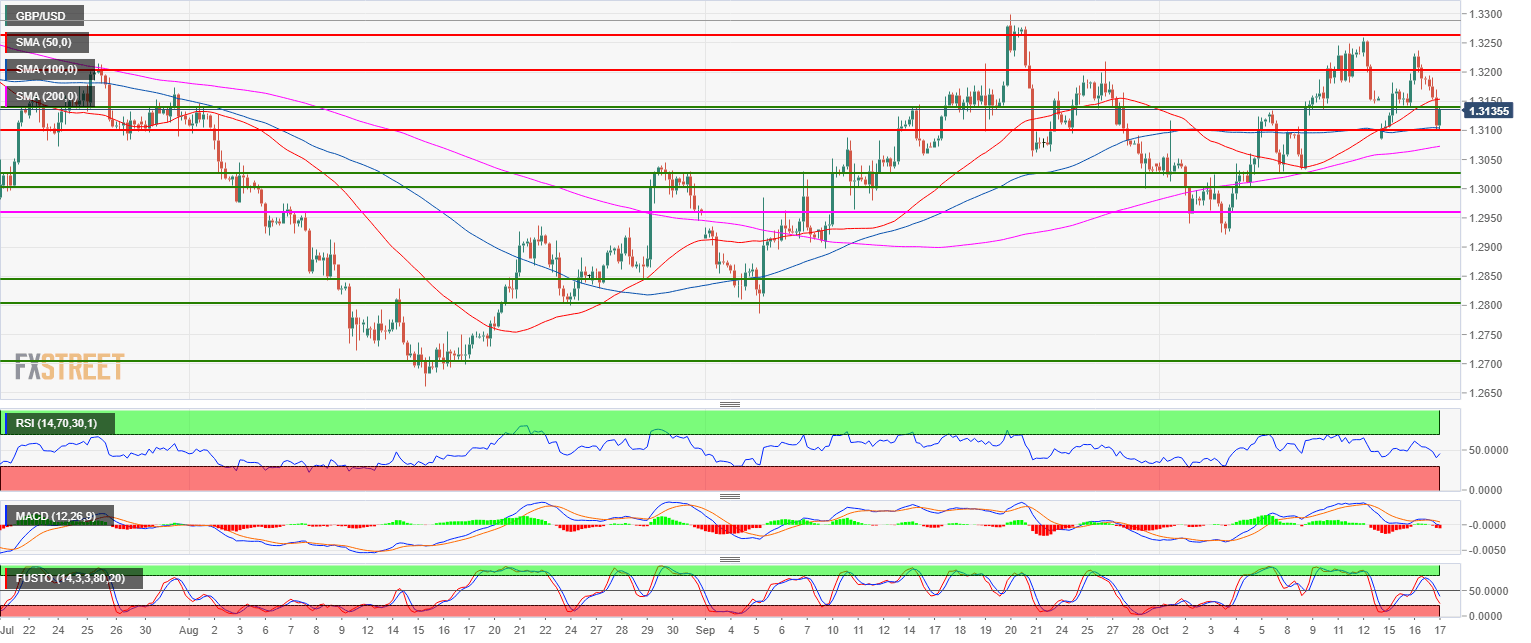
- GBP/USD is trading in a bull trend above the 200-period simple moving average on the 4-hour chart.
- GBP/USD found some support above the 1.3100 figure and the 100-period simple moving average as the bulls have momentarily halted the recent slide down. The RSI, MACD and Stochastic are still in bearish territories suggesting that the bulls still have work to do to be back in control. The next resistance to the upside is likely located near 1.3140 (October 16 low) and 1.3200 figure.
- A bear breakout below 1.3100 on a daily closing basis would invalidate the bullish bias.
GBP/USD 4-hour chart
Spot rate: 1.3133
Relative change: -0.37%
High: 1.3194
Low: 1.3099
Main trend: Bullish
Resistance 1: 1.3140 October 16 low
Resistance 2: 1.3200 figure
Resistance 3: 1.3259 October 12 high
Resistance 4: 1.3237 October 16 high
Resistance 5: 1.3300 September 20 high
Resistance 6: 1.3370 July 9 high
Support 1: 1.3100 figure
Support 2: 1.3050 August 30 swing high, key level
Support 3: 1.3028 October 8 low
Support 4: 1.3000 figure
Support 5: 1.2957 July 19 swing low
