- 10-day SMA has been over prices since May 08.
- A horizontal-line near 1.2600 offered repeated reversals during the present year.
Even since the GBP/USD pair slipped beneath 10-day simple moving average (SMA) during early-month, the prices have never recovered as the quote ticks around 1.2675 ahead of the UK markets’ open on Tuesday.
With the pair’s failure to cross immediate SMA, chances of its slip to re-test 1.2600 horizontal-region comprising multiple lows since late-December 2018 seems brighter.
In a case where bears keep dragging the quote southwards below 1.2600, 1.2480 and 1.2440 could flash on their radars.
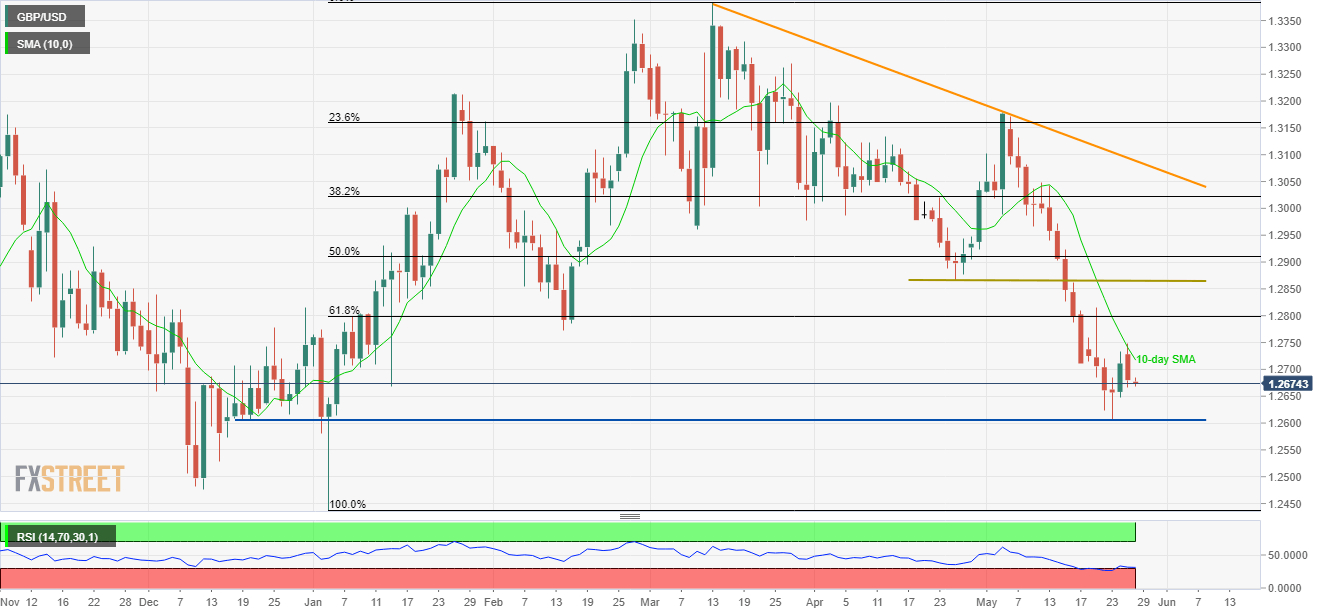
On the contrary, the pair’s break of 10-day SMA level of 1.2720 enables it to challenge 61.8% Fibonacci retracement of January – March upside, surrounding 1.2800.
If bulls manage to cross the 1.2800 mark, 1.2860/70 horizontal-area including April low and May 16 high could be on their targets.
GBP/USD daily chart
Trend: Bearish
