- Bearish MACD, lower-highs, failure to cross the key resistance-confluence signal the GBP/USD pair’s declines.
- A two-day-old support-line could offer an intermediate halt to 1.2200.
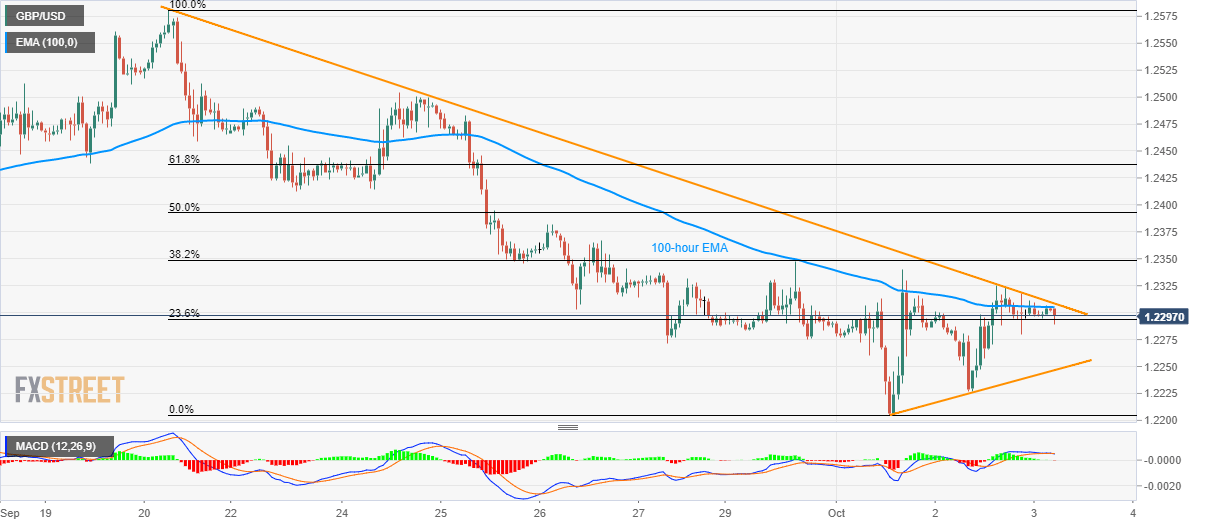
Not only failures to cross multi-day old descending trend-line and 100-hour exponential moving average (EMA) but lower high formation and bearish MACD also increase odds of the GBP/USD pair’s declines. The pair currently flashes 1.2290 as a quote prior to the UK open on Thursday.
It should be noted that the pair tests 23.6% Fibonacci retracement of a downpour since September 20, at 1.2294, a sustained break below the same could join bearish signal by 12-bar moving average convergence and divergence (MACD) to aim for immediate rising support-line, at 1.2230.
In a case prices fail to bounce off 1.2230, 1.2200 could become bears’ favorite.
Meanwhile, an upside break of 1.2305/10 resistance-confluence will set the tone for fresh run-up towards 1.2380 and 1.2415 whereas 61.8% Fibonacci retracement near 1.2440 could question bulls afterward.
Given the pair’s extended rise past-1.2440, 1.2500 and 1.2585 could lure optimists.
GBP/USD hourly chart
Trend: bearish
