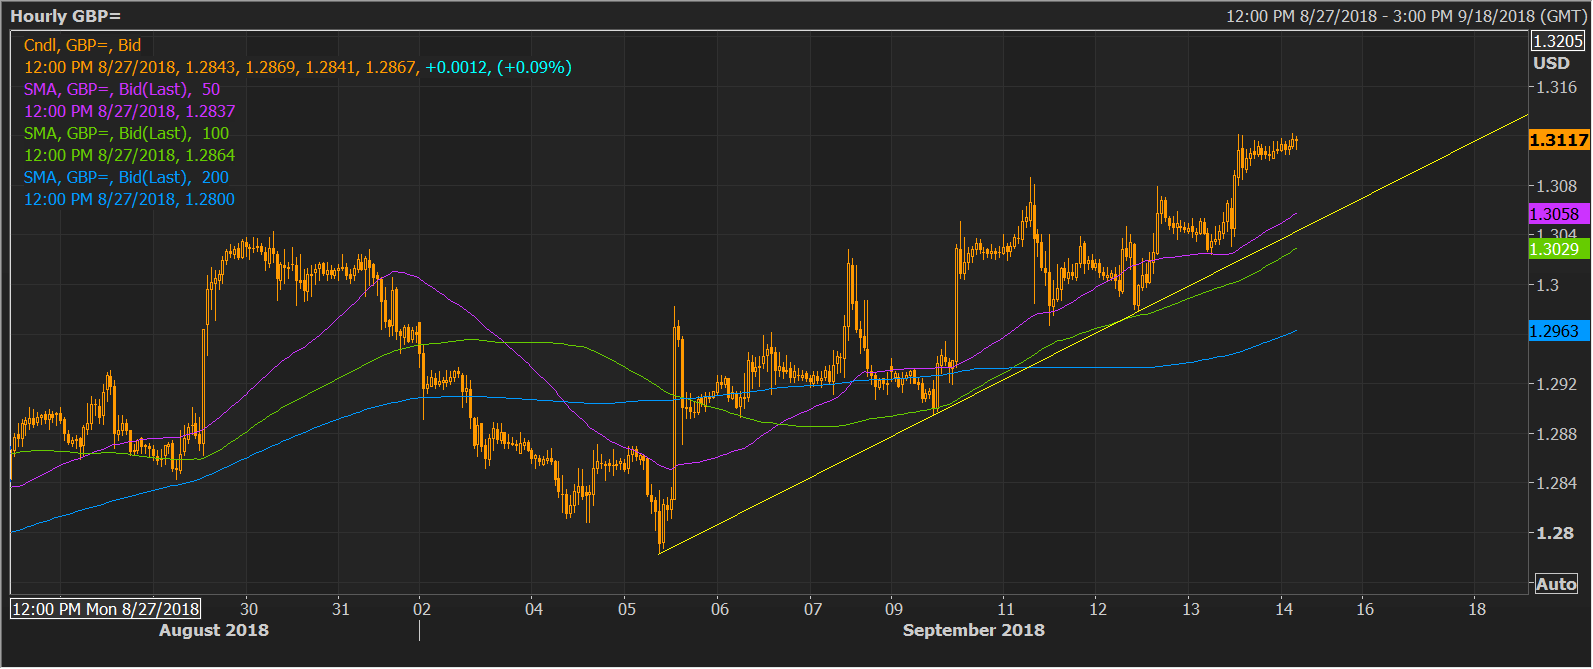
- For GBP/USD, the path of least resistance is on the higher side, the higher highs and higher lows, ascending 50-hour, 100-hour and 200-hour MAs indicate.
- The currency pair closed well above 1.3087 (Tuesday’s doji candle high) yesterday, adding credence to the bullish setup on the hourly chart.
- A close today above the trendline connecting the July 6 high and July 9 high would accentuate the bull case and could yield a sustained move above 1.3204 (May 29 high).
Hourly chart
Daily chart
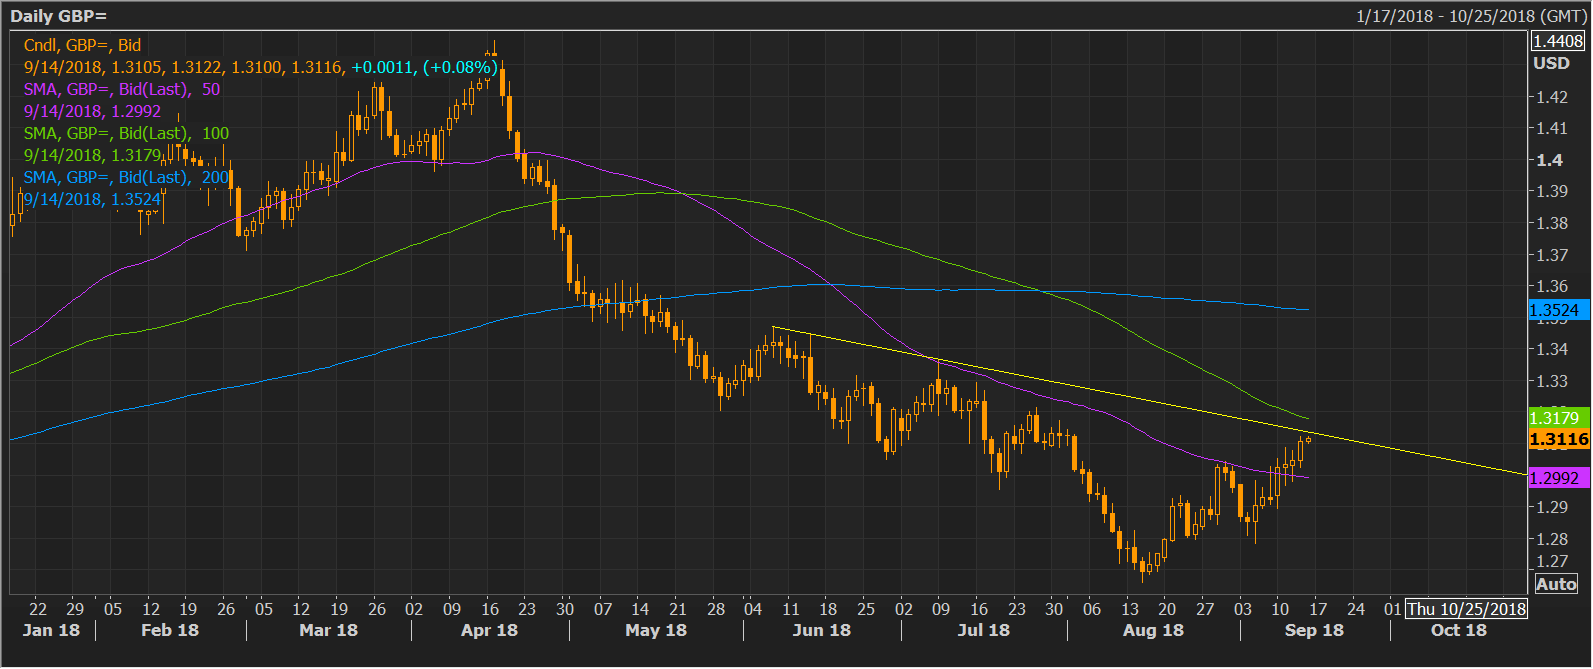
Spot Rate: 1.3117
Daily High: 1.3122
Daily Low: 1.3098
Trend: Bullish
R1: 1.3118 (trendline hurdle)
R2: 1.3178 (100-day moving average)
R3: 1.3204 (May 29 low)
Support
S1: 1.3064 (5-day moving average)
S2: 1.3046 (daily pivot S1)
S3: 1.30 (psychological support)
