- 21-day EMA triggers GBP/USD pullback.
- Downside break below June low can drag prices back to 1.2440, 1.2382.
With the 21-day exponential moving average (EMA) limiting the GBP/USD pair’s recent recovery, the quote is declining to 1.2530 heading into the London open on Friday.
However, sellers await a downside break of July 09 low of 1.2506 in order to aim for 1.2440 and the monthly bottom surrounding 1.2382.
Meanwhile, pair’s ability to cross 21-day EMA level of 1.2560 could further propel it towards a downward-sloping trend-line since early-May around 1.2595.
If at all buyers manage to cross 1.2595 barrier, also dominate beyond 1.2600 round-figure, late-June lows around 1.2660 could be on their radar.
GBP/USD daily chart
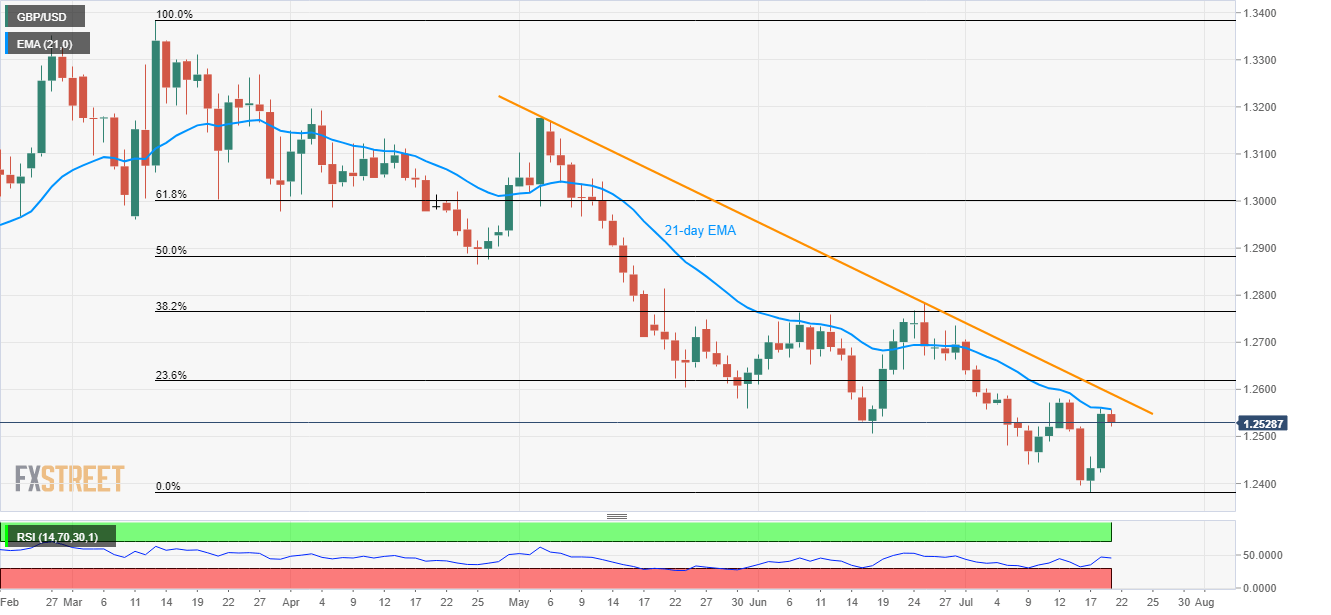
Trend: Pullback expected
