GBP/USD is trading in a range as a new week of trading and Brexit headlines begins. UK GDP stands out on Monday and the pair has room to the upside.
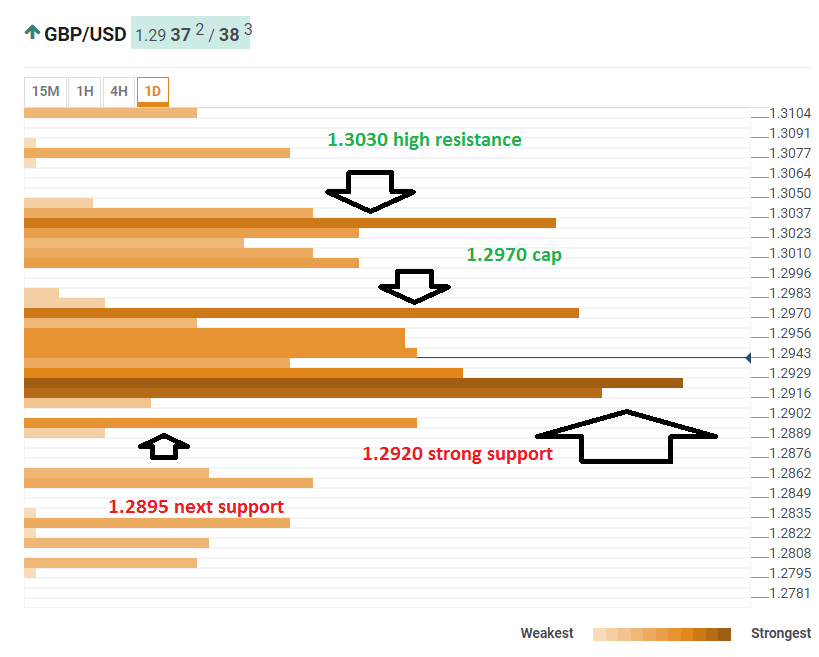
The Technical Confluences Indicator shows that cable enjoys significant support around 1.2920 where we see a dense cluster including the Fibonacci 38.2% one-month, the Friday’s low, the Pivot Point one-day Support 1, the Fibonacci 23.6% one-week, and the Bollinger Band 1h-Lower.
The next support line is quite close. At 1.2895 we note the convergence of the Pivot Point one-day Support 2, the Simple Moving Average 100 one-day, and the SMA 200-4h.
Resistance is weaker than support and found at 1.2970. It is the convergence of the SMA 5-1d, the BB 1h-Upper, and the PP one-day R1.
The next significant juncture of resistance lines is at 1.3030 where we see the SMA 200-1d, the SMA 100-4h, and the Fibonacci 23.6% one-month converge.
This is how it looks on the tool:
Confluence Detector
The Confluence Detector finds exciting opportunities using Technical Confluences. The TC is a tool to locate and point out those price levels where there is a congestion of indicators, moving averages, Fibonacci levels, Pivot Points, etc. Knowing where these congestion points are located is very useful for the trader, and can be used as a basis for different strategies.
This tool assigns a certain amount of “weight” to each indicator, and this “weight” can influence adjacents price levels. This means that one price level without any indicator or moving average but under the influence of two “strongly weighted” levels accumulate more resistance than their neighbors. In these cases, the tool signals resistance in apparently empty areas.
