- Fed Chair Powell indicated rates might need to rise if the US economy remained robust.
- More Americans than usual last week filed new claims for unemployment benefits.
- Investors are concerned about the upcoming US inflation report.
The GBP/USD weekly forecast is bearish as the dollar rises amid indications of higher rates for longer and a robust labor market.
–Are you interested to learn more about forex options trading? Check our detailed guide-
Ups and downs of GBP/USD
Although he reaffirmed that “disinflation” is already in motion, Fed Chair Powell on Tuesday indicated rates might need to rise if the US economy remained robust.
Contrary to expectations, more Americans than usual last week filed new claims for unemployment benefits, although the underlying pattern remained consistent with a tight labor market.
Despite escalating economic headwinds brought on by the Federal Reserve’s interest rate hikes, the labor market has remained resilient. The labor market’s strength signals that the much-anticipated recession is not imminent.
Britain’s economy had zero growth in the final three months of 2022, keeping it from going into recession for the time being. However, the economy will face difficult circumstances in 2023 as families struggle with double-digit inflation.
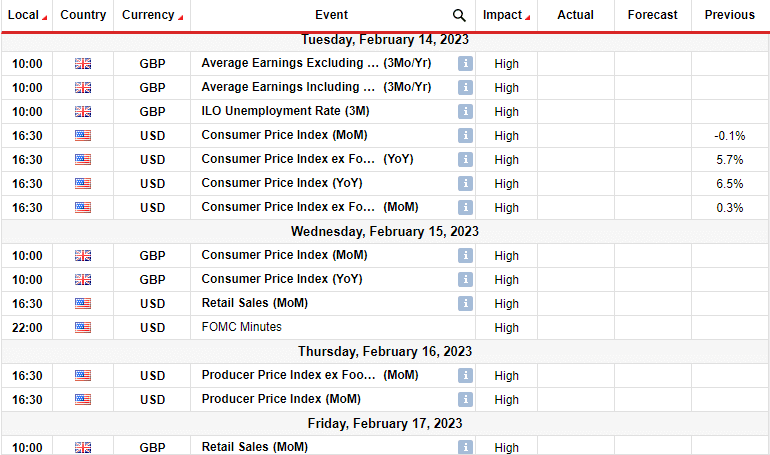
Next week’s key events for GBP/USD
Investors are concerned about the upcoming US inflation data because it might show a bigger number than the markets had anticipated. According to surveys by the University of Michigan on Friday, the one-year inflation outlook was 4.2%, higher than the final figure from January.
The Michigan survey’s inflation outlook is one indicator that the Federal Reserve monitors.
Investors will also pay attention to UK inflation.
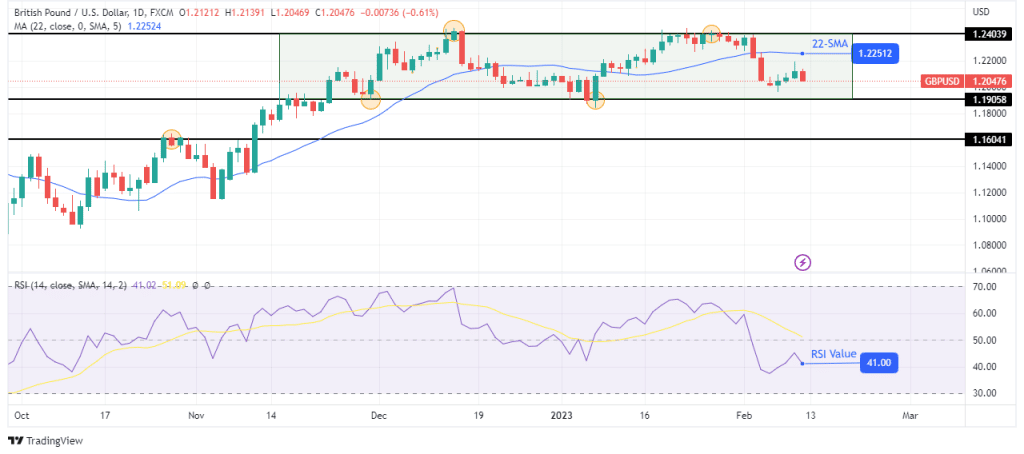
GBP/USD weekly technical forecast: Bears eye the 1.1905 range support
The daily chart shows GBP/USD trading below the 22-SMA with the RSI below 50, pointing to a strong bearish move. However, on the larger scale, the price is caught in a sideways move, with the 1.2403 level as resistance and the 1.1905 level as support.
–Are you interested to learn about forex robots? Check our detailed guide-
The previous move was bullish, and bulls were stopped at the 1.2403 resistance. Although they made another attempt to break above this level, the RSI made a lower low, pointing to weakness in the bullish move. The fact that bears had also managed to break below the 22-SMA showed they were getting stronger.
If bears attempt a takeover, we might see the price reaching and taking out the 1.1905 support before heading for the 1.1604 support.
Looking to trade forex now? Invest at eToro!
67% of retail investor accounts lose money when trading CFDs with this provider. You should consider whether you can afford to take the high risk of losing your money.


