- The focus shifted from domestic data to rising inflation and a tighter BOE policy.
- Next week’s GDP data from the UK and US will show how the economies handle higher interest rates.
- The RSI shows weakness in the bears on the daily chart.
The GBP/USD weekly forecast is positive as the Bank of England is expected to come up with a hawkish tone. The pair is struggling to sustain above 1.2300 area. A hawkish central bank in the UK could push sterling higher in the coming week with the possibility of inflation peaking in the US and the dollar declining.
–Are you interested in learning more about Canadian forex brokers? Check our detailed guide-
Ups and downs of GBP/USD
GBP/USD closed the week higher, the first time in three weeks. The UK released many domestic data, including retail sales, inflation, and the purchasing managers’ index. Retail sales declined while the composite PMI for June came in higher than expected. Inflation is also on the rise in the UK.
“High inflation, rising recession fears, and central bank tightening are more important than domestic data readings,” said Milhøj.
Several speeches included the Bank of England’s Chief Economist, Huw Pill, who said that the central bank would continue to use interest rates in the fight against inflation as it prepares to reverse part of its economic stimulus push.
Next week’s key events for GBP/USD
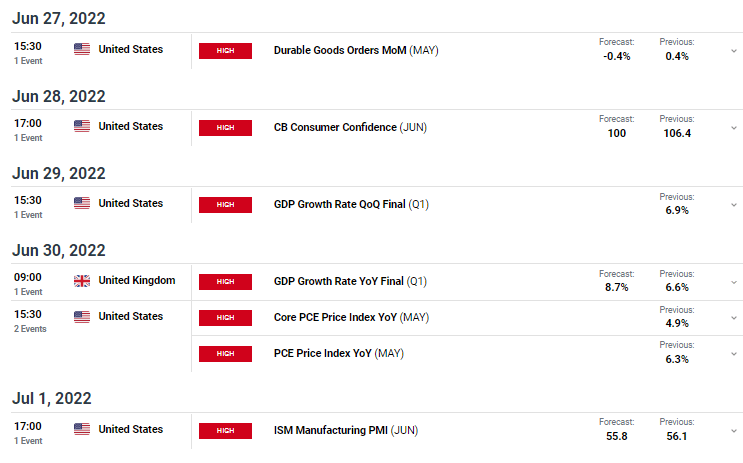
In the coming week, GBP/USD investors will receive economic data from the UK and the US, with the majority coming from the US. Both countries will release Gross Domestic Product data which will inform investors about the health of their economies.
The state of each country’s economy is essential as it informs their central banks about the effects of rising interest rates. If an economy is doing poorly, the central bank is more likely to relax its monetary policy to support the economy.
GBP/USD weekly technical forecast: RSI divergence to push above 22-SMA
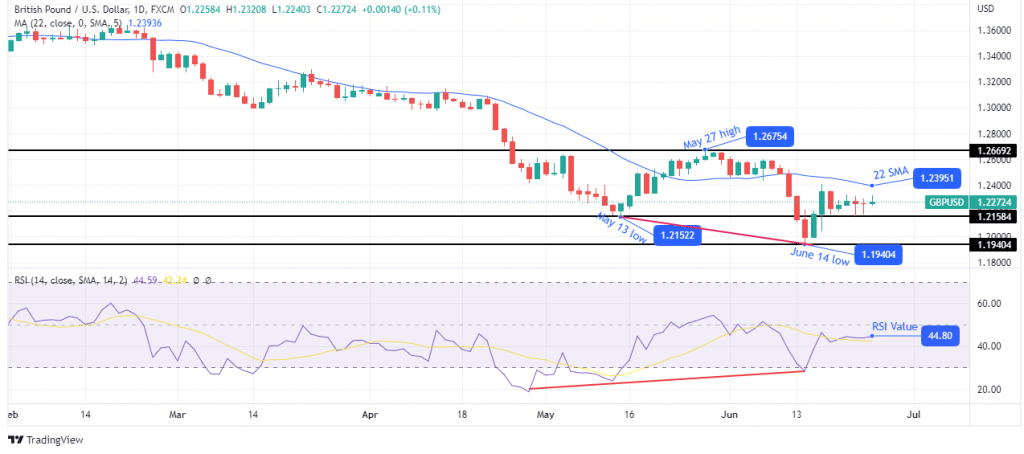
Looking at the 4-hour chart, we see the price pushing toward the 22-SMA after making a lower low below the May 13 low. The 22-SMA has acted as resistance on previous occasions and might do so now. The RSI is trading below 50, favoring bearish momentum. However, a bullish divergence between the price and RSI indicates weakness in the bearish trend.
–Are you interested in learning more about high leveraged brokers? Check our detailed guide-
If the RSI divergence plays out, we could see the price breaking above the 22-SMA and retesting the May 27 high at 1.26754. However, if the bullish divergence fails, we could see the price retesting and possibly breaking below the June 14 low at 1.19404.
Looking to trade forex now? Invest at eToro!
68% of retail investor accounts lose money when trading CFDs with this provider. You should consider whether you can afford to take the high risk of losing your money
