GBP/USD posted gains for a second straight week, closing at 1.3122. This week’s key events are Manufacturing and Construction PMI reports. Here is an outlook on the major market-movers and an updated technical analysis for GBP/USD.
In the US, new home sales beat expectations and durable goods reports also beat their estimates. On the other hand, GDP matched the forecast and Janet Yellen remained cautious in Jackson Hole. Anticipation is high ahead of a busy month that features both the BoE and the Federal Reserve making critical decisions.
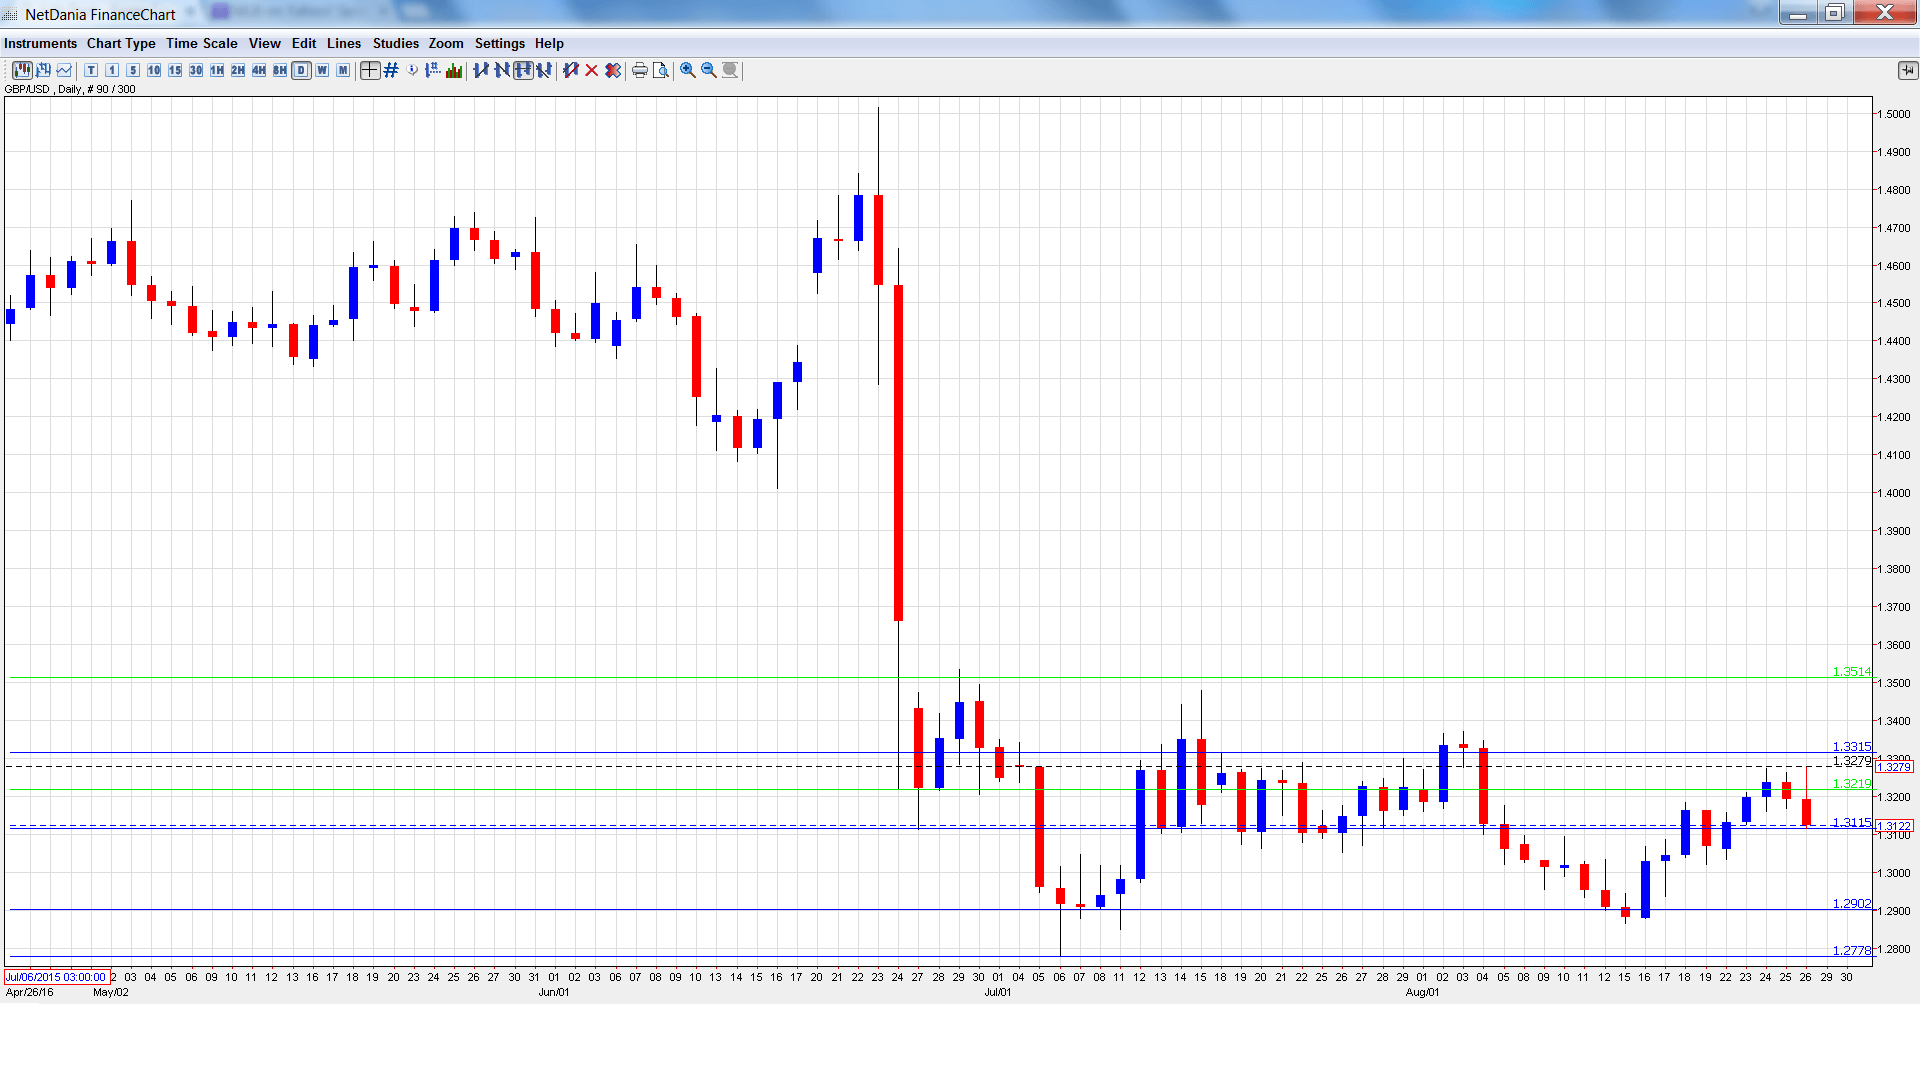
[do action=”autoupdate” tag=”GBPUSDUpdate”/]GBP/USD graph with support and resistance lines on it. Click to enlarge:
- Nationwide HPI: 30th-3rd. This indicator provides a snapshot of the level of activity in the housing sector. The indicator posted a gain of 0.5% in July, well above the forecast of 0.0%. The markets are braced for a decline of 0.1% in the August report.
- Net Lending to Individuals: Tuesday, 8:30. This indicator is closely watched as increased borrowing often translates into greater spending levels. The indicator climbed to GBP 5.2 billion in June, well above the forecast of GBP 4.2 billion. The forecast for the July release stands at GBP 4.9 billion.
- GfK Consumer Confidence: Tuesday, 23:05. Consumer Confidence has looked particularly weak in the past two readings, with readings of minus -9 and minus -12 in July. Another weak reading is expected in August, with an estimate of -8 points.
- Manufacturing PMI: Thursday, 8:30. This indicator dipped to 48.2 points in June, pointing to contraction in the manufacturing sector. The estimate for the July release stands at 49.1 points.
- Construction PMI: Friday, 8:30. Construction PMI dipped to 45.9 points in June. little changed from the previous release. This marked a second consecutive reading below the 50-level, which separates contraction from expansion. The forecast for July stands at 46.6 points.
* All times are GMT
GBP/USD Technical Analysis
GBP/USD opened the week at 1.3061 and quickly touched a low of 1.3033, testing support at 1.3053 (discussed last week). The pair was uneventful until Friday, when the pound climbed to a high of 1.3279, before reversing directions and closing the week at 1.3122.
Live chart of GBP/USD: [do action=”tradingviews” pair=”GBPUSD” interval=”60″/]
Technical lines from top to bottom
We start at 1.3514, which has been a resistance line since late June.
1.3315 was a cap in July.
1.3222 is next.
1.3112 marked the low point in June.
1.2902 is protecting the 1.29 line.
1.2778 was a cushion in mid-July.
1.2680 is the final support level for now.
I am neutral on GBP/USD.
The Fed remains divided over a rate hike, but a December move is certainly on the table. British numbers have been surprisingly strong since Brexit, but concern remains about the strength of the UK economy, and it’s questionable if Q3 data will continue to look solid.
Our latest podcast is titled Time to inflate inflation targeting and the suspicious oil rally
Follow us on Sticher or on iTunes
Further reading:
- For a broad view of all the week’s major events worldwide, read the USD outlook.
- For EUR/USD, check out the Euro to Dollar forecast.
- For the Japanese yen, read the USD/JPY forecast.
- For the kiwi, see the NZD/USD forecast.
- For the Australian dollar (Aussie), check out the AUD to USD forecast.
- For the Canadian dollar (loonie), check out the USD to CAD forecast.
