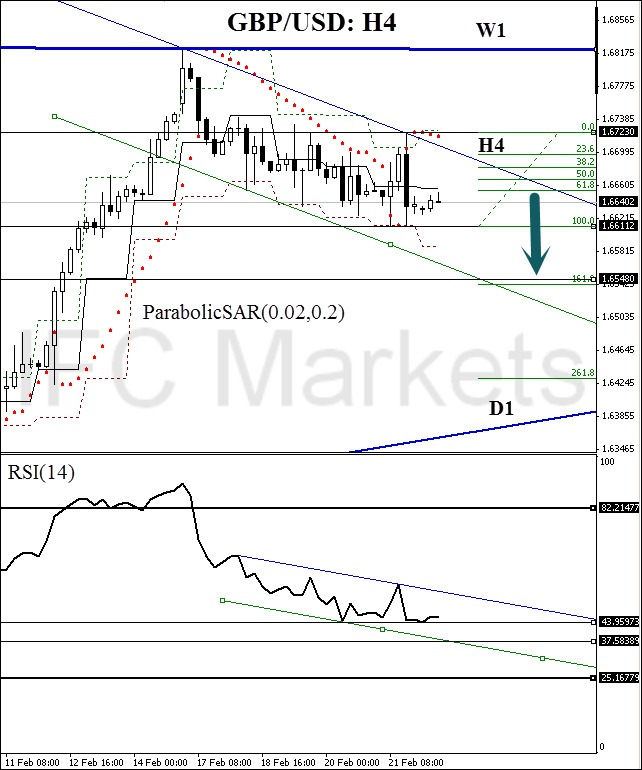
The H4 trend has a bearish direction. Note that the likely potential for the movement will continue, until the price reaches the daily rising support line. At the moment, both ParabolicSAR and the RSI(14) confirm the downward direction.
Note that the price of the currency pair has also crossed the Pivot signal line from above. This is an additional bearish confirmation signal, that adds more confidence to the forecast. The Resistance at 1.67230 is confirmed by both parabolic and first Pivot resistance.
This means that risks can be confidently limited at this level while bearish trading. A pending sell order can be placed at the level 1.66112, which is also confirmed by previous values of the ParabolicSAR and Pivot. The target is defined according to Fibonacci with correction focusing to historical extremes.
GBP/USD chart:
It would be wise to open the breakthrough order 15 minutes before publishing of the Flash Services PMI and keep the position, if the macroeconomic indicator rises above the predicted value 56.9. In any case, the position should be switched into a breakeven condition at 16:30 (CET), at this time Dallas Federal Reserve manufacturing activity index in the sphere of production from the Federal Reserve Bank of Dallas is expected to be published.
Further reading: Pound/dollar forecast.

