GBP/USD was quite volatile last week, showing strong movement in both directions. The pair ended the week down by about a cent, closing at 1.6057. This week’s major releases include Asset Purchase Facility and the Official Bank Rate. Here is an outlook of the events and an updated technical analysis for GBP/USD.
It was a busy week for GBP/USD. The pound shot up over 200 pips following fiscal cliff, but the US dollar then recovered. The pound was also hurt by weak UK data, with Services PMI and Construction PMI both falling well below the estimate. The Trade Deficit came in at -9.2 billion pounds, a bit higher than the estimate of -9.1 billion. There were no surprises as all eyes were on the BOE on Thursday. The central bank maintained the benchmark interest rate at 0.50%, and QE remained at 375 billion pounds. The pound has bounced back after recent losses, as GBP/USD was trading at 1.6088.
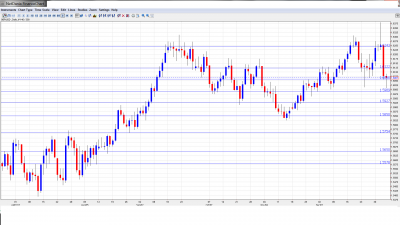
GBP/USD graph with support and resistance lines on it. Click to enlarge:
- Halifax HPI: Monday, 8:00. This housing inflation index looked sharp in December, climbing by 1.0%. This was the first gain since July. The markets are expecting a very modest gain this month, with the estimate standing at 0.2%.
- BRC Retail Sales Monitor: Tuesday, 00:01. This indicator precedes the official Retail Sales release, and measures those retailers belonging to the British Retail Consortium. After a slight drop in November, the indicator rebounded last month, climbing 0.4%. Will the indicator remain in positive territory in the upcoming reading?
- BRC Shop Price Index: Wednesday, 00:01. This consumer inflation indicator has posted two straight readings with gains of 1.5%, indicating a reasonable level of inflation for goods and services. The markets will be hoping for a similar figure in the January release.
- Trade Balance: Wednesday, 9:30. Trade Balance disappointed last month, as the monthly deficit widened to 9.0 billion pounds. This was substantially higher than the estimate of -8.7B. The January forecast calls for a smaller deficit, with an estimate of -9.0B. Will the indicator meet or beat the market forecast?
- Asset Purchase Facility: Thursday, 12:00. The BOE releases its QE amount each month, and the markets carefully monitor not only the actual amount, but also the breakdown of the vote prior to the decision. QE has remained pegged at 375K since June, and the markets are not expecting any change in the January announcement.
- Official Bank Rate: Thursday, 12:00. The benchmark interest rate has the potential to be a market mover, as any change in interest rates will directly affect the value of the pound. However, the BOE has not changed the level of interests rates in over three years, and the markets are expecting the 0.50% rate to remain intact.
- Manufacturing Production: Friday, 9:30. Manufacturing Production has shown some volatility of late. This key indicator declined by 1.2% in December, well below the forecast of -0.2%. The markets are expecting a turnaround in January, with the estimate standing at a gain of 0.6%.
- Industrial Production: Friday, 9:30. This indicator has dropped for three consecutive months, underscoring continuing weakness in the UK manufacturing sector. The estimate for the January release calls for a gain of 0.8%, and the markets will be hoping that the indicator will indeed rebound.
- NIESR GDP Estimate: Friday, 15:00. This indicator tries to estimate GDP on a monthly basis, as the official GDP release is only published every quarter. The indicator has not looked sharp, as it has been posting smaller gains over the past two months. Last month’s release was a paltry gain of just 0.1%. The markets will be hoping for a stronger reading in January.
*All times are GMT
GBP/USD Technical Analysis
GBP/USD opened the week at 1.6160. After fiscal cliff, the pound shot up, touching a high of 1.6381. The pair then retracted, dropping sharply to a low of 1.6009. GBP/USD closed the week at 1.6057.
Technical lines from top to bottom:
We begin with resistance at 1.6747, which has not been tested since May. This is followed by resistance at the round number of 1.66. Below, is the line of 1.6475. This line has held firm since August 2011. This is followed by resistance at 1.6343. This line was breached as GBP/USD moved sharply higher, but remained in place after the pair retracted. Next, there is resistance at 1.6247. This is followed by 1.6122, which was providing support last week. This line saw a lot of activity in December. Below, 1.6060 is providing weak resistance. The pair ended the week just shy of this line, and it could be tested early next week.
GBP/USD is receiving support at 1.5992. This line has held firm since the end of November, but the pair did approach the 1.60 level during its slide last week. This is followed by 1.5930. Next, there is strong support at 1.5850. This line has been solid since mid-November, when the pound began its rally against the greenback. This is followed by 1.5750, a strong support line which has not been tested since August. Next, there is support at 1.5648. The final support line for now is 1.5573.
I am bearish on GBP/USD.
After a steady rally by the pound which began in mid-November, GBP/USD has shown some volatility. The pound jumped following the fiscal cliff deal, but lost ground soon afterwards. Any weak data out of the US will make investors nervous, and bolster the safe-haven dollar. If the UK does not produce any strong numbers, we could see the pound dip below the critical 1.60 level.
Further reading:
- For a broad view of all the week’s major events worldwide, read the USD outlook.
- For EUR/USD, check out the Euro to Dollar forecast.
- For the Japanese yen, read the USD/JPY forecast.
- For the Australian dollar (Aussie), check out the AUD to USD forecast.
- For USD/CAD (loonie), check out the Canadian dollar forecast.

