After bouncing up from weekly 200 SMA and 50% FIBO level last week cable also failed to sustain its bullish momentum. The pair failed break its bearish channel and found its resistance at the channel’s upper boundary, 1.6220 level. Meanwhile RSI also bounced back from its down-sloping channel indicating possibility of further bearish developments.
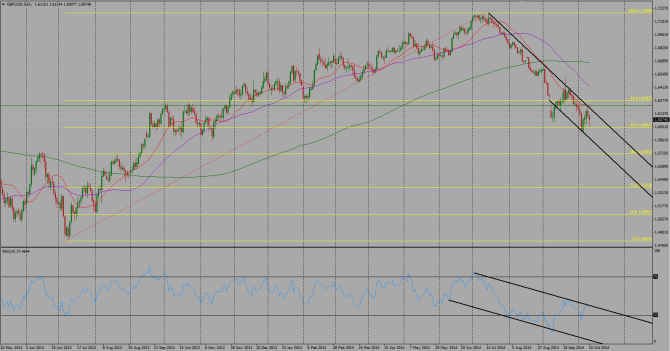
Meanwhile on hourly time frame, GBP/USD formed a death cross (crossover of 200SMA and 50 SMA) which is considered to be a strong bearish signal; however the pair could not breach its psychological 1.6000 level, which also happens to be 50% FIBO support level and bounced up.
Despite relatively strong support level at 1.6000 level both on daily and hourly timeframes all the moving averages currently indicate further potential bearish development, RSI has bounced up from its oversold zone.
Expectations for the upcoming week (Oct 13th – Oct 17th):
The pair is trading within the boundaries of its bearish channel, all the moving averages (SMA20, SMA 50 and SMA200) are all above current price levels and all sloping down with aforementioned strongly bearish death-cross moving averages crossover. May we see break below 1.6000 psychological support level the pair will potentially move towards 1.5909 level as its next support level. 1.5909 has been a strong support level since November 2013.
Following support levels are 1.5746, which was an important support line in January 2013.
Since the market is in consolidation mode, it is recommended to wait for trend confirmation.
Resistance levels: 1.6120, 1.6225 and 1.6290
Support levels: 1.6000, 1.5909 and 1.5746
Guest post by Yuri Safronov at Orbex
