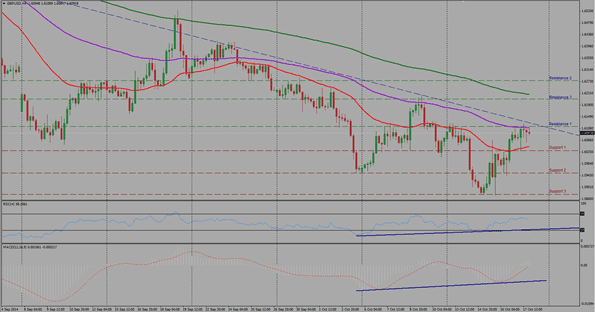
After worse than expected UK CPI Data on Tuesday, October 14th bears took cable towards 1.5870 levels (inverse Fibonacci 23.6 level) where the pair found its next support level. Although the pair had a strong bullish momentum during the second half of the week, the pair could not breach its down-sloping trendline and closed the week below it at 1.6090 levels.

Despite Lower Lows and Lower Highs made, we can see bullish divergence forming up on MACD and RSI on 4 hour time frame. Additionally 20SMA is also indicating bullish signal by sloping upwards and 50SMA becoming flat, however, from a broader perspective, the pair is still trading within the boundaries of three SMAs, which is an indication of sideway market development.
Expectations for the upcoming week (Oct 20th – Oct 24th):
At the time of analysis, the pair is trading slightly below its resistance line of 1.6115 (Resistance 1 – Green line). A clear and decisive break out of the current resistance level would indicate bullish trend development towards R2@ 1.6212 and [email protected] levels. The overall current trend is sideways with bullish technical bias. Meanwhile, may we see a break below 1.6000 psychological support level during the week the pair would potentially move towards 1.5950 and 1.5880 levels as its next support levels.
On daily timeframes may our short-term support levels be broken, 1.5760 and 1.5600 would be the following support levels, which had been key support and resistance levels in 2013.
Since the market is in consolidation mode, it is recommended to wait for the trend confirmation.
Resistance levels: 1.6115, 1.6212 and 1.6280
Support levels: 1.6030 (1.6000 being psychological support zone), 1.5950 and 1.5880.