- XAU/USD starts the trading week reaching levels not seen since late 2012.
- The level to beat for bulls is the 1740 resistance.
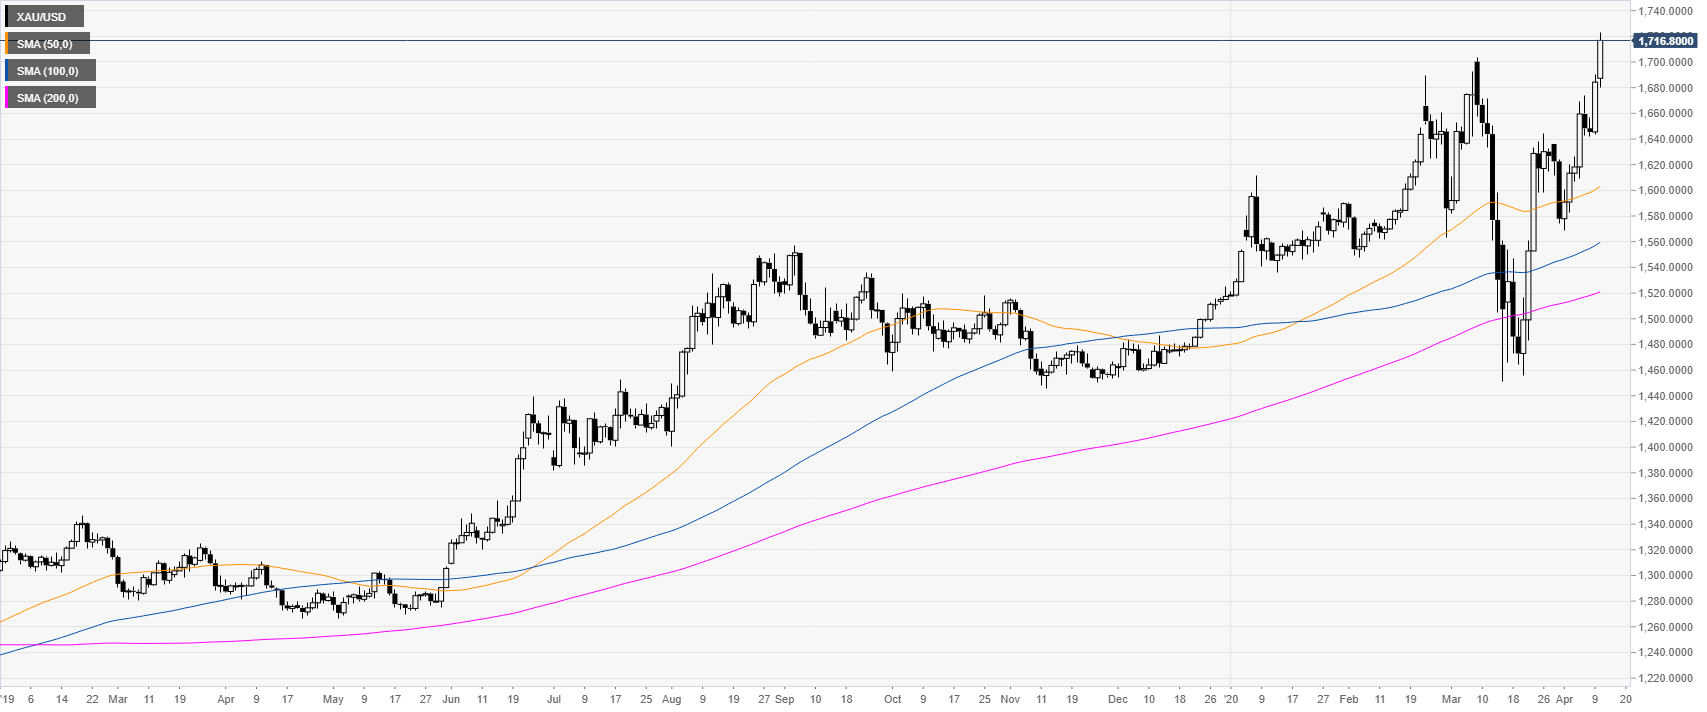
XAU/USD daily chart
Gold broke to fresh 2020 highs while trading above the main DMA (daily simple moving averages) suggesting that buyers remain in full control of the market.
XAU/USD four-hour chart
XAU/USD is trading above the main SMAs while breaking above the 1690/1700 resistance zone as bulls are eyeing the 1740 and 1780/1800 levels on the way up. On the flip side, support can emerge near the 1690/1700 price zone and the 1660 level on any dip down.
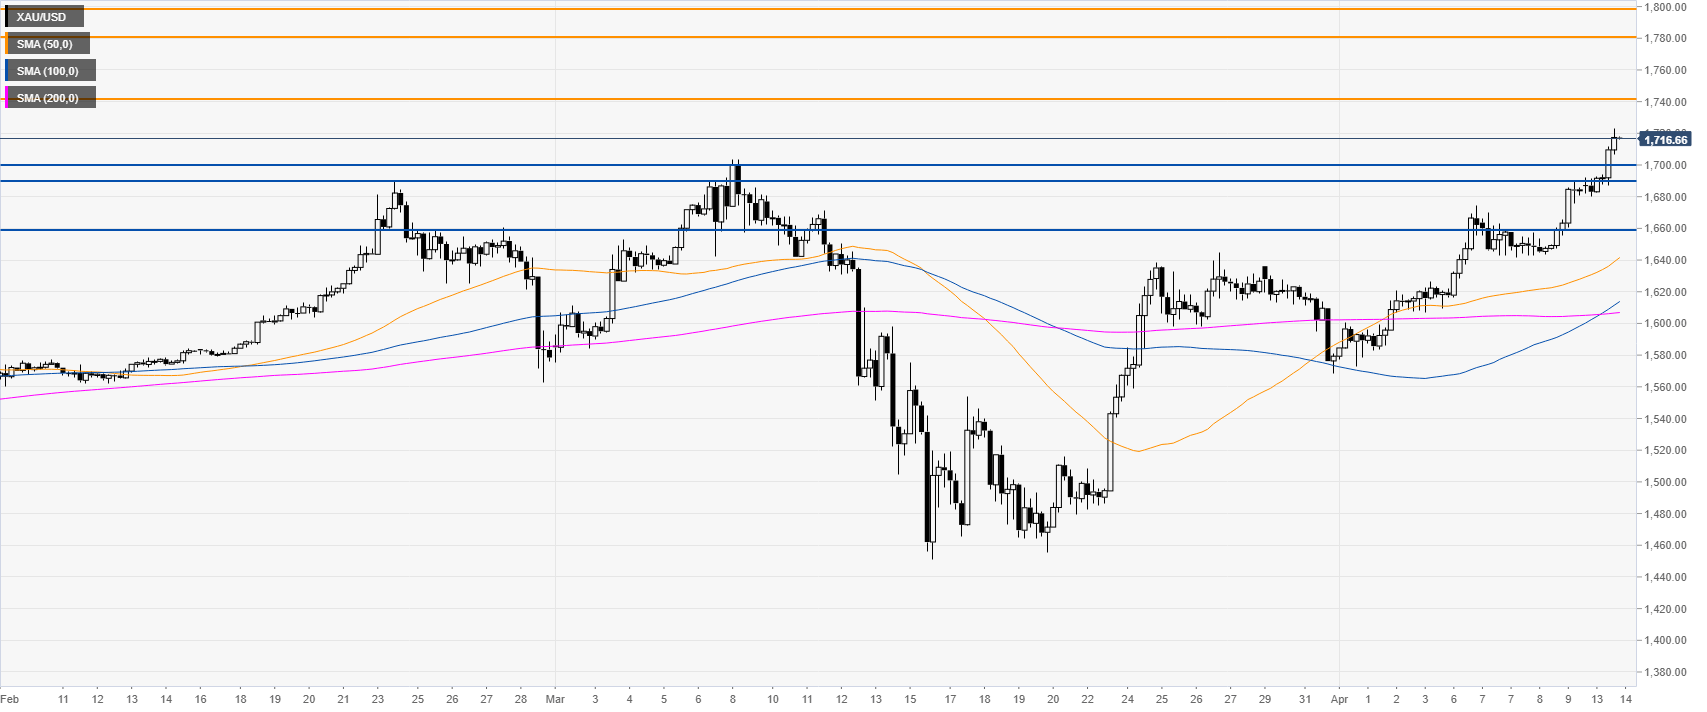
Additional key levels
