The big picture in Gold hasn’t changed much over the past month. For approximately nine weeks now Gold has been consolidating around prior support of 1,182.20, a price first hit back in June of 2013. This price area was then tested as support first in December 2013, then more recently in May 2014. During that 16-month time frame Gold consolidated forming a bearish descending triangle pattern. It broke out to the downside nine weeks ago. However, there has been no follow through as it bounced off 1,132.08 and has crept higher since, closing at 1,189.60 last week.
This leads one to suspect that Gold could rally higher before going lower, if it is to eventually go lower. In this regard it is interesting to note that on the monthly chart Gold dropped below its 55-month exponential moving average (ema) in June 2013 for the first since January 2002. During the formation of the triangle the 55-month ema area was tested as resistance a number of times. Being a significant long-term trend indicator, this is considered a bearish sign.
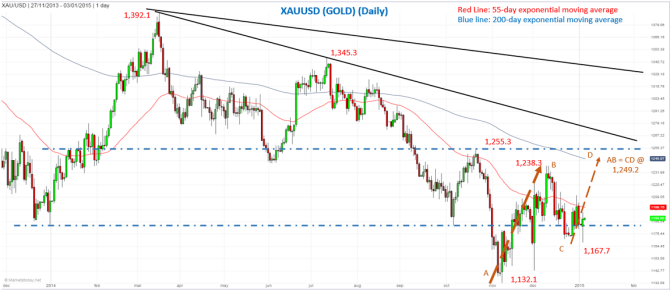
In the near-term, a further bounce back up into the triangle formation and a test of resistance is possible. Trade above and a close above the recent swing high of 1,255.3 will give a bullish trend continuation signal on the daily chart, while a bullish trend continuation signal occurs on the monthly chart on a move above 1,238.3.
Lower down, a short-term bearish AB=CD pattern at 100% completes at 1,249.2. If Gold holds above the most recent swing low of 1,167.7, the odds favor a rally into at least the 1,249 price area. It could then see at least a short-term decline from there.
Guest post by Bruce Powers of MarketsToday.net
