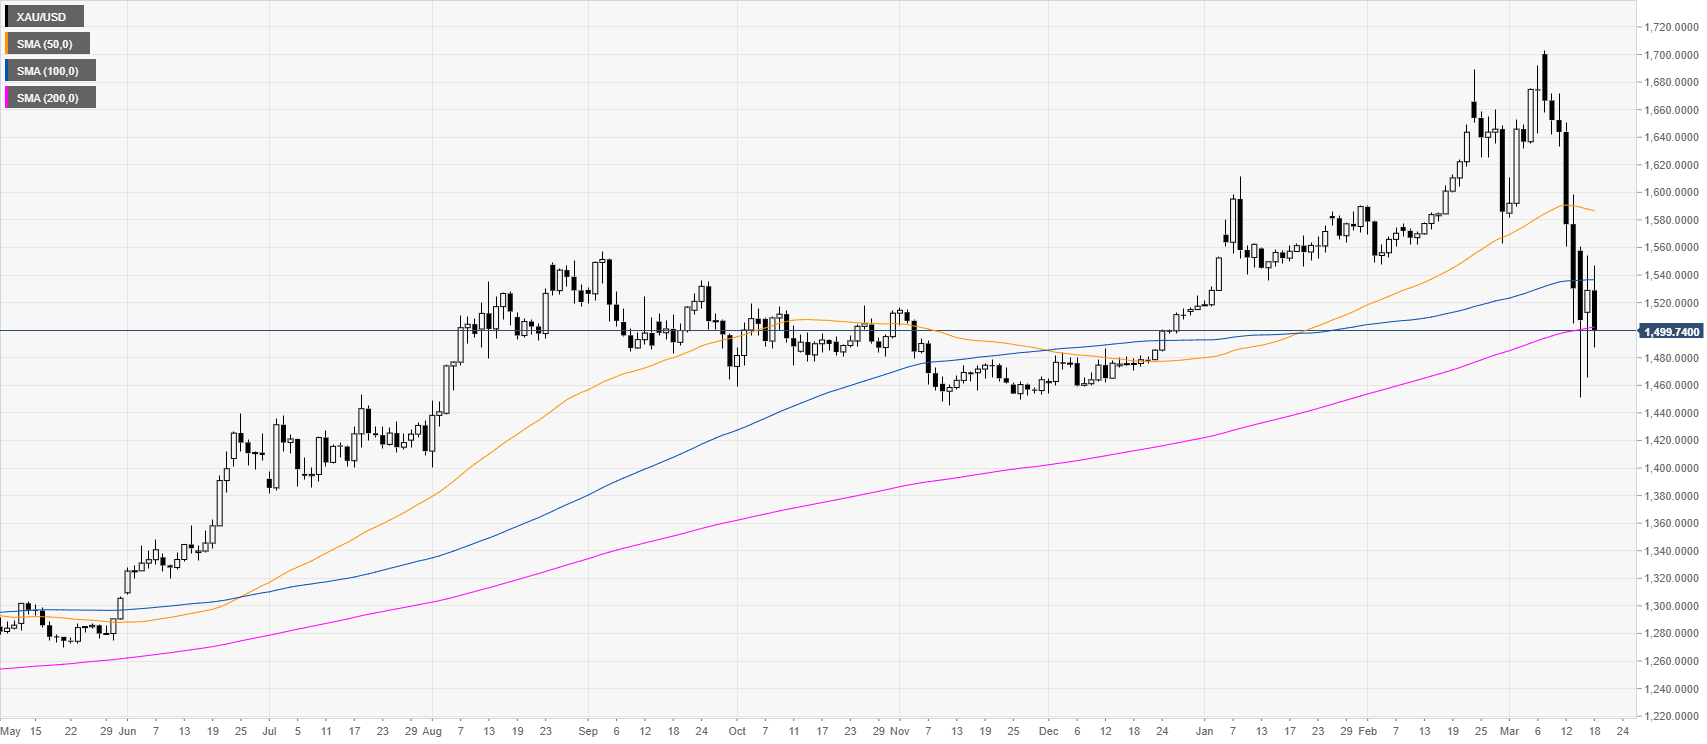
- XAU/USD is consolidating after recording its largest weekly decline since 1983 last week.
- XAU/USD appears to be consolidative in the medium term.
XAU/USD daily chart
Last week, gold suffered its worst weekly decline since 1983, erasing the 2020 gains while challenging the 200 SMA on the daily chart. XAU/USD is consolidating the losses near $1500 per troy ounce.
XAU/USD four-hour chart
XAU/USD is consolidating the losses near $1500 per troy ounce while trading well below the main SMAs suggesting an overall bearish bias in the medium term. A break below the 1500 level can send gold down towards the 1480 and 1440 price levels while bulls will try to defend the 1500 mark. Resistance is seen near the 1530 and 1548/57 price levels.
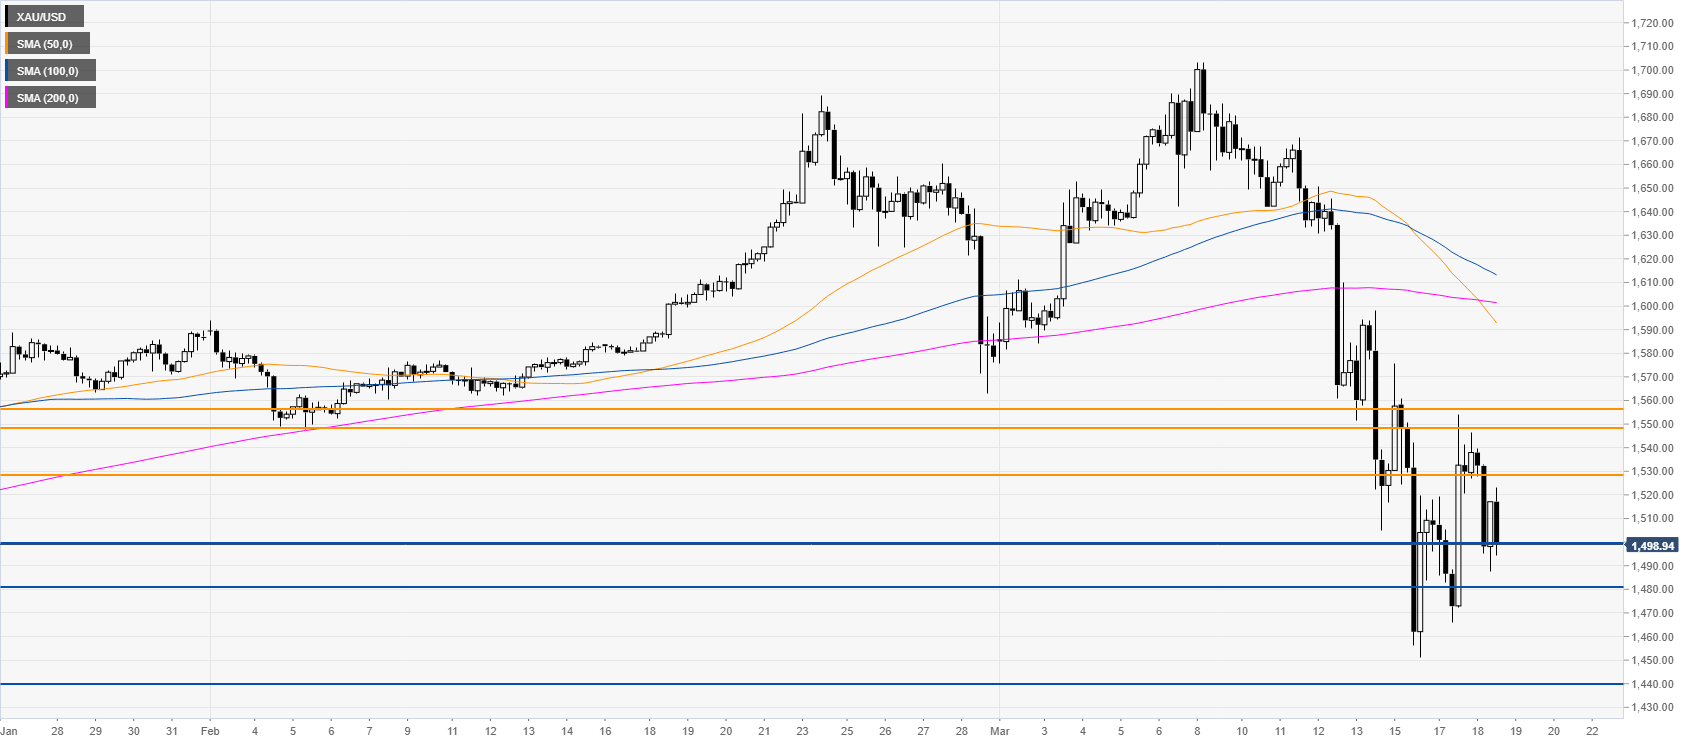
Resistance: 1530, 1548, 1557
Support: 1500, 1480, 1440
Additional key levels
