- Gold is gyrating the $1,200 mark since August 28.
- Friday’s bull breakout failed, putting the yellow metal bears back into the driver’s seat. However, the metal has rebounded from $1,195 to $1,200 in Asia.
- Last month’s long-tailed candle indicates the 5-month losing streak has likely run out of steam. So, a corrective rally is more likely in the short-run.
Hourly chart
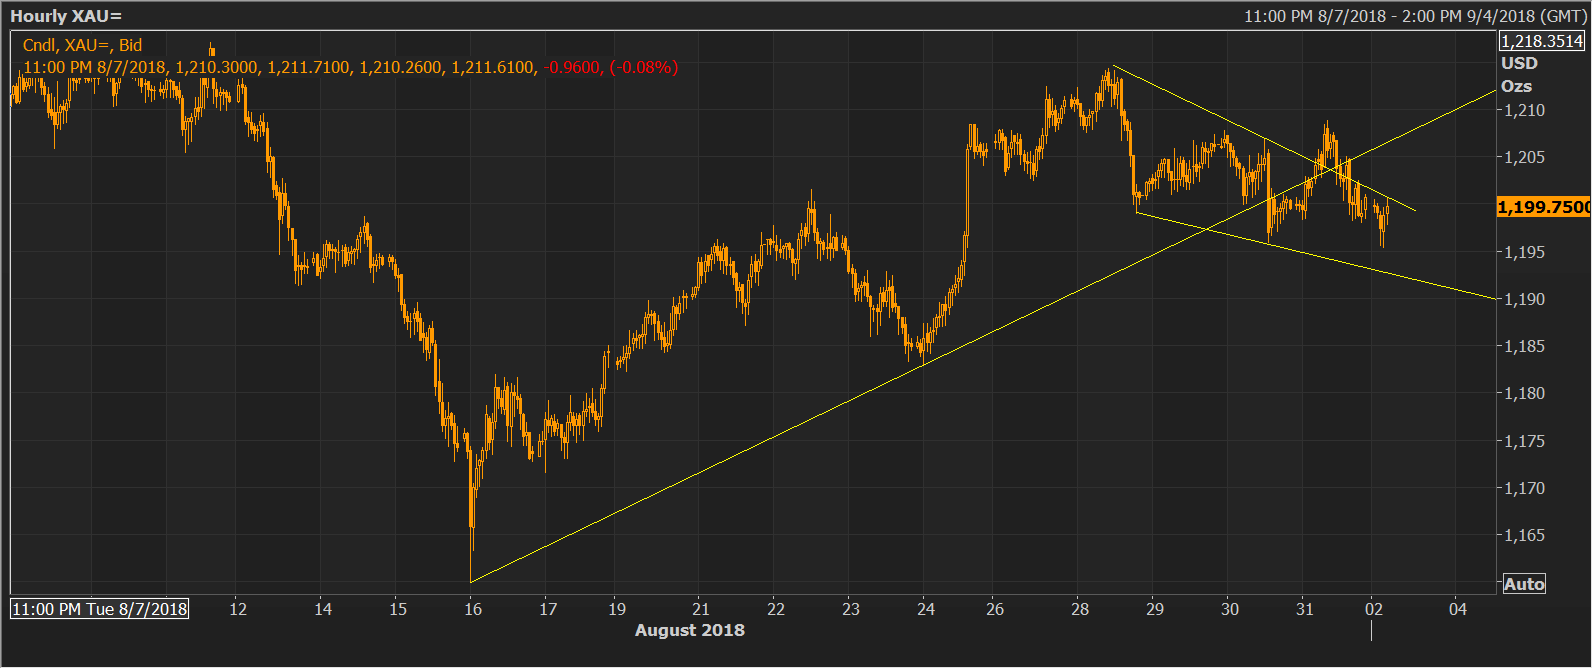
Spot Rate: $1,200
Daily High: $1,201
Daily Low: $1,195
Trend: Neutral to bullish
Resistance
R1: $1,204 (100-hour moving average)
R2: $1,209 (Aug. 31 high resistance on the hourly chart)
R3: $1,214.30 (Aug. 28 high)
Support
S1: $1,195 (Sep. 3 low)
S2: $1,187 (50% Fib R of $1,160/$1,214.30)
S3: $1183.28 (Aug. 24 low)
