Gold (XAU/USD) consolidates the post-Fed decision volatility, having faced rejection just below the record high of $1981.34. Investors resort to profit-taking after the dovish Fed induced surge.
The bias, however, remains in favor of the bulls, as the US 10-year real yields meander near new life-time lows of -0.95%. The Fed pledged to keep the monetary policy accommodative to fight the coronavirus impact on the economy, boosting the yieldless gold at the expense of the real rates and the US dollar.
Attention now turns towards the critical US Q2 Preliminary GDP report for fresh trading impetus on the yellow metal. Let’s take a look at how it is positioned technically ahead of Thursday’s key event risk.
Key resistances and supports
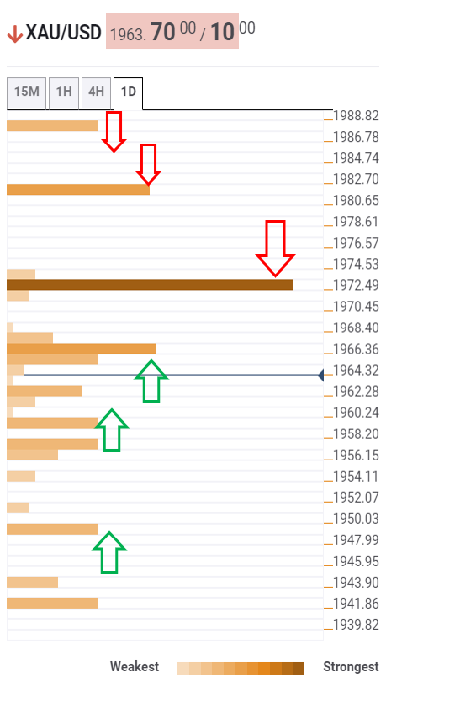
The tool shows that the bright metal sees the immediate upside capped at the powerful resistance of $1972.50, the intersection of the Fibonacci 23.6% one-day, previous week high four-hour and pivot point one-week R2.
Ahead of that key support, the bears could test the downside cushion at $1943, which is the confluence of the SMA10 four-hour and SMA50 one-hour.
A break above the latter will open doors for a retest of the all-time highs near $1981. Buyers will then aim for the next hurdle at $1988, which is the pivot point one-day R1, on it way to the $2000 level.
Alternatively, the bears are likely to have a tough time extending its control, as a cluster of minor support levels will impede gold’s corrective decline.
The immediate cushion is seen at $1960/55 region, the convergence of Bollinger Band one-day Upper, Fibonacci 61.8% one-day and SMA10 four-hour.
A failure to resist above that level, the $1949 support will be put to test, the pivot point one-day S1.
Here is how it looks on the tool
About the Confluence Detector
The Confluence Detector finds exciting opportunities using Technical Confluences. The TC is a tool to locate and point out those price levels where there is a congestion of indicators, moving averages, Fibonacci levels, Pivot Points, etc. Knowing where these congestion points are located is very useful for the trader, and can be used as a basis for different strategies.
Learn more about Technical Confluence
