- Gold remains in a pullback mode with key Fib hurdle at $1,994 intact.
- The hourly chart shows a rising wedge pattern with support at $1,953.
Gold is currently trading at $1,982 per ounce, representing a 0.15% decline on the day, having printed a high of $1,990 on Monday.
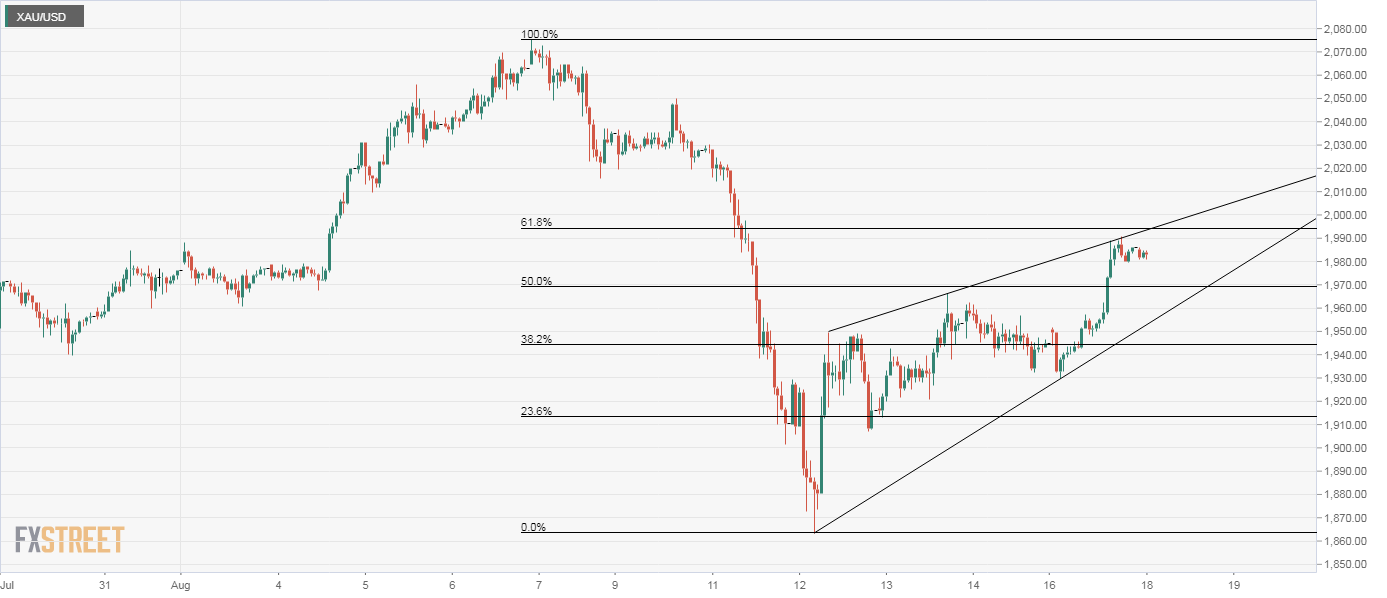
The yellow metal has recovered by more than $100 from the recent low of $1,862, however, a bull revival is still not confirmed as the resistance at $1,994 – the 61.8% Fibonacci retracement of the sell-off from $2,075 to $1,862 – remains intact.
A break above $1,994 would mean the pullback from the record high of $2,075 reached on Aug. 6 has ended and signal a resumption of the bull trend.
Traders should note that the recent bounce has taken the shape of a rising wedge on the hourly chart. A move below the lower end, currently at $1,953, would imply an end of the bounce from $1,862 and shift risk in favor of a re-test of $1,900.
Hourly chart
Trend: Neutral
Technical levels
