- Gold fails to extend bounce off multi-day low.
- A bullish candlestick pattern needs validation from a break of 21-day SMA.
- 50% of Fibonacci retracement limits near-term declines.
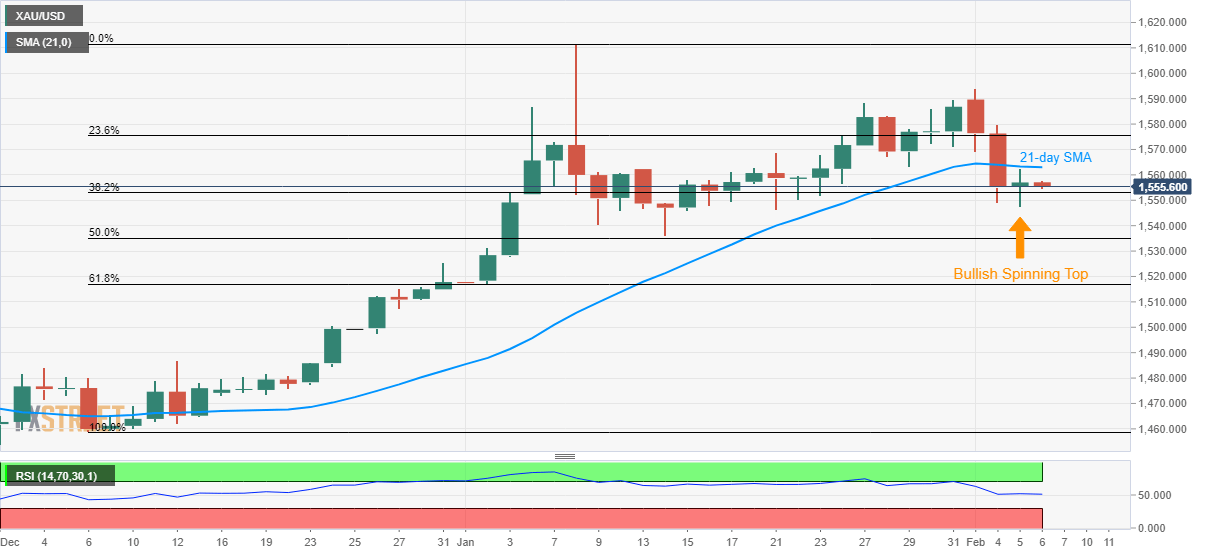
Gold prices step back to $1,555.50 during Thursday’s Asian session. In doing so, the yellow metal stays below 21-day SMA despite portraying a bullish candlestick formation the previous day.
As a result, the bullion needs to cross a 21-day SMA level of $1,563 to justify the bullish spinning top and aim for 23.6% Fibonacci retracement of December 2019 to January 08 upside near $1,575.
In a case where the quote manages to stay positive above $1,575, it’s the run-up to the monthly top surrounding $1,594 and $1,600 round-figure can’t be ruled out.
Alternatively, $1,536/35 area including January 14 low and 50% Fibonacci retracement limits the precious metal’s near-term declines.
Should there be a downside below $1,535, the yearly bottom close to 61.8% Fibonacci retracement, at $1,517, will gain the bear’s attention ahead of $1,500 mark.
Gold daily chart
Trend: Sideways
