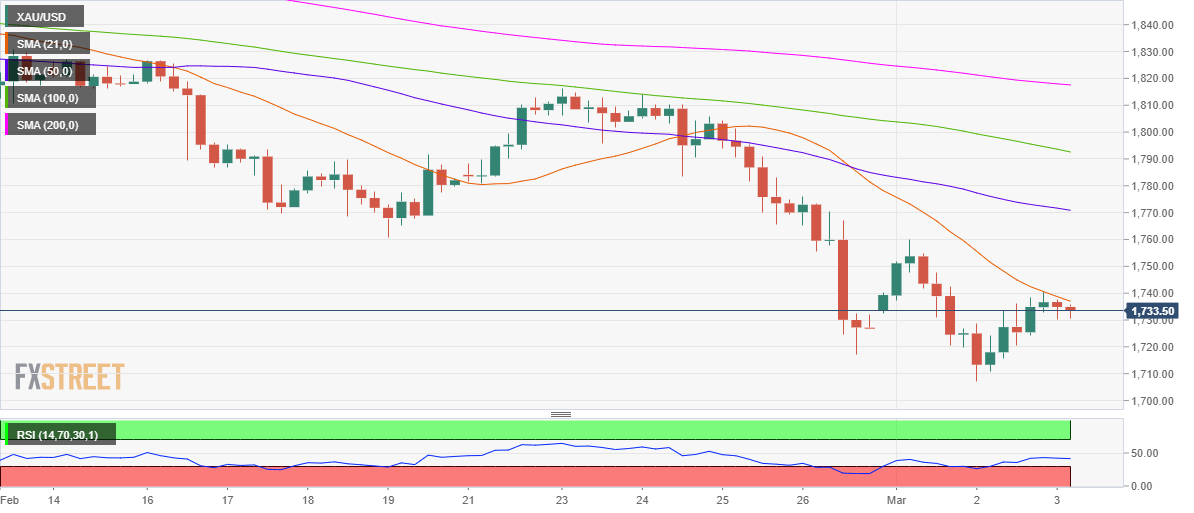
- XAU/USD spots symmetrical triangle breakdown on the 1H chart.
- RSI point south, within the bearish zone, allowing more declines.
- Downside more compelling amid a bunch of healthy resistance levels.
Gold (XAU/USD) has returned to the red zone, as the US dollar appears to have found its feet after Tuesday’s corrective decline.
The US dollar is attempting a rebound despite the 0.50% advance in the S&P 500 futures, which reflects the risk-on market mood.
Gold traders await the key US ADP jobs and ISM Services PMI data for fresh directives. In the meantime, the yellow metal could likely remain at the mercy of the dollar dynamics.
From a short-term technical perspective, the bearish 21-simple moving average (SMA) at $1736 on the four-hour chart is capping the recovery attempts, at the moment.
The Relative Strength Index (RSI) has turned lower, suggesting that the recovery momentum could be losing steam.
Therefore, the eight-month lows of $1707 is back on the sellers’ radars.
Gold Price Chart: Four-hour
If the buyers manage to find acceptance above the 21-SMA barrier, the psychological $1750 level could be put to test.
Further up, the downward-sloping 50-SMA at $1771 would then challenge the bullish commitments.
Gold Additional levels

