Gold kicked-off a fresh week on the defensive amid the upbeat market mood, although held onto the $1770 level. The stimulus expectations led rally on the global stocks could likely weigh on the safe-haven. Key technical levels to watch.
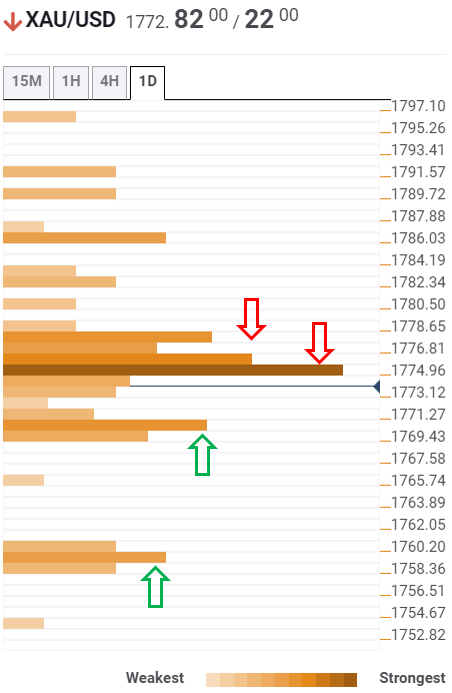
The Technical Confluences Indicator shows that the yellow metal faces a stiff resistance at $1776, which is the convergence of the Fibonacci 61.8% one-day and Bollinger Band 15-minutes Middle and SMA100 1H.
The next upside hurdle awaits at $1777, where the previous day high and Fibonacci 38.2% one week coincide.
Acceptance above the latter will trigger a fresh rally towards the $1786 target, the previous month high.
Alternatively, the immediate downside appears cushioned at $1770, the confluence of the Fibonacci 61.8% one-week, Fibonacci 161.8% one-day and previous low on one-hour.
A break below that level could pave the way for additional declines, with $1759 (Fibonacci 23.6% one-month) on sellers’ radar.
Here is how it looks on the tool
Confluence Detector
The Confluence Detector finds exciting opportunities using Technical Confluences. The TC is a tool to locate and point out those price levels where there is a congestion of indicators, moving averages, Fibonacci levels, Pivot Points, etc. Knowing where these congestion points are located is very useful for the trader, and can be used as a basis for different strategies.
This tool assigns a certain amount of “weight” to each indicator, and this “weight” can influence adjacents price levels. These weightings mean that one price level without any indicator or moving average but under the influence of two “strongly weighted” levels accumulate more resistance than their neighbors. In these cases, the tool signals resistance in apparently empty areas.
Learn more about Technical Confluence
