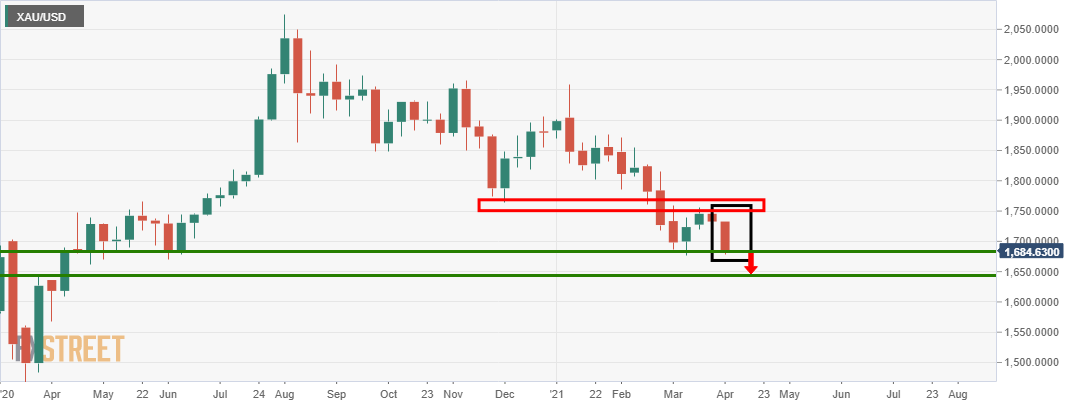
- Gold is in the hands of the bears meeting critical support.
- The US dollar is on fire and US yields continue to climb.
The Archegos fallout and higher Treasury yields continue to cast a shadow of uncertainty over markets, but despite that, gold prices are down heavily as the USD picks up the safe-haven title instead.
At the time of writing, XAU/USD is trading at $1,685 between a range of $1,678.77 and a high of $1,714.44, down some 1.5% on the day.
The greenback, on the other hand, has defied gravity, from a technical perspective at least, and is trading 0.38% higher and breaking new positive territory scoring a high of 93.3540 having climbed from a low of 92.8810 as measured by the DXY index.
As for US Treasury yields, these have continued to move higher with the new fiscal impulse in the pipeline.
The 10-year yield is scored a new cycle high of 1.7740% a day before President Joe Biden is set to outline how he intends to pay for a $3 trillion to $4 trillion infrastructure plan.
Increasing US vaccinations and plans for a major stimulus package have stoked inflation expectations and lifted US Treasury yields.
The dollar also rose above 110 yen, a level not seen since March last year, and was last up 0.45% on the day at 110.27 vs a high of 110.42.
Nonfarm Payrolls risks
This week’s Nonfarm Payrolls will be closely monitored for more inflationary risks.
The US dollar would be expected to benefit from an inline number which would be an additional weight for gold.
However, given quarter-end flows and the fact that the data is released on good Friday, most of the leg work is potentially already priced in and a sell the fact scenario could be the playbook prior to further gains.
Gold technical analysis
As per the prior analysis, Gold Price Analysis: XAU/USD bears taking control, eyes on a breakout, &, Gold Price Analysis: XAU/USD suffers at the hands of the US 10-year yield spiking, the downside bias thesis has played out.
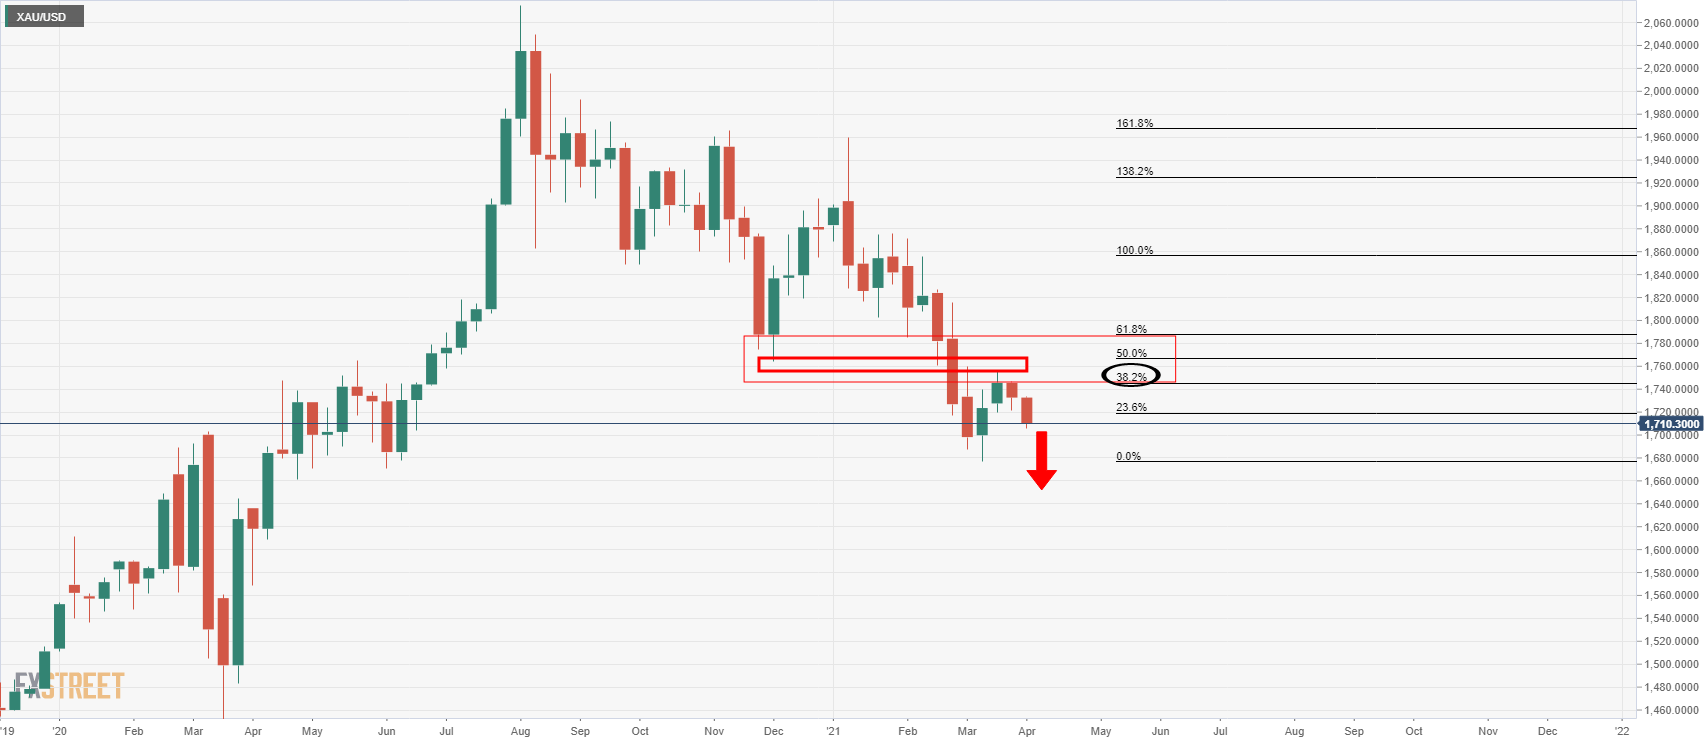
The weekly outlook was bearish in that the market had corrected the bearish impulse in a significant Fibonacci retracement and the daily price action in the sideways channel was bearish.
Prior analysis, daily
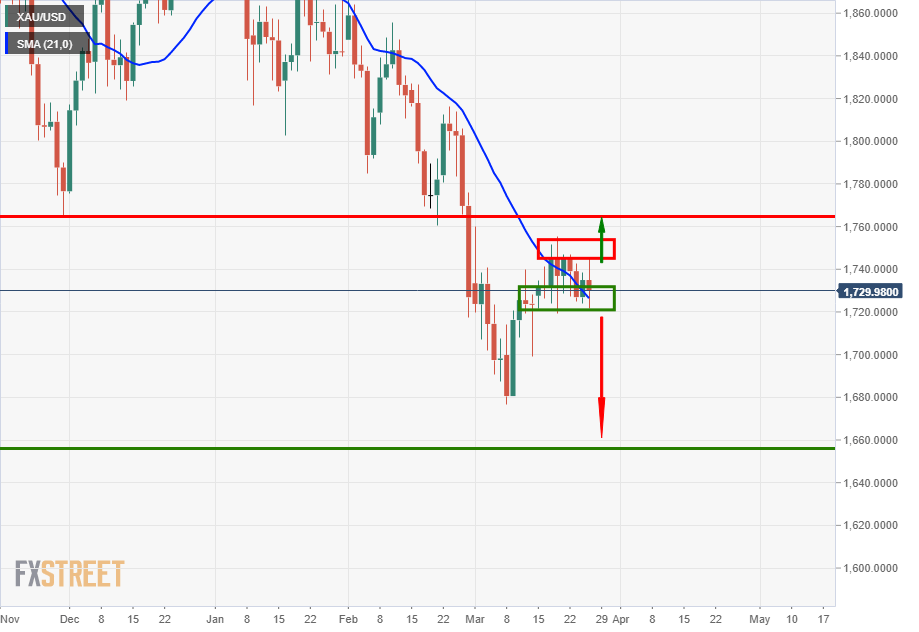
As can be seen, the price remains trapped, but there is a bearish bias within the channel as follows:
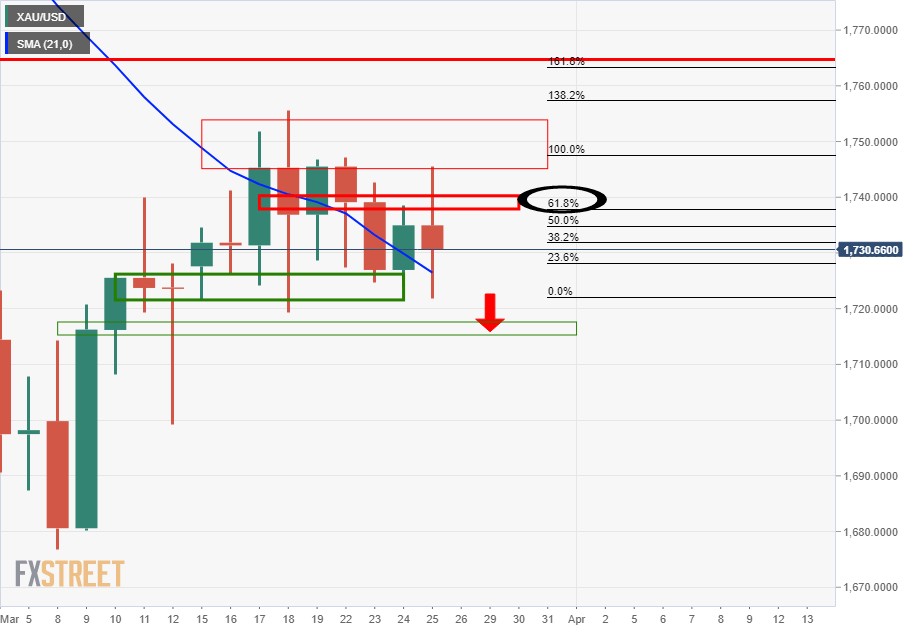
The latest bearish impulse has seen a correction to the 61.8% Fibonacci and beyond, although there are prospects of a downside extension at this juncture on a break of $1,717.
Prior analysis, weekly
The weekly outlook is bearish in that the market has corrected the bearish impulse in a significant Fibonacci retracement which would now be expected to see a continuation to the downside.
Live market, daily & weekly
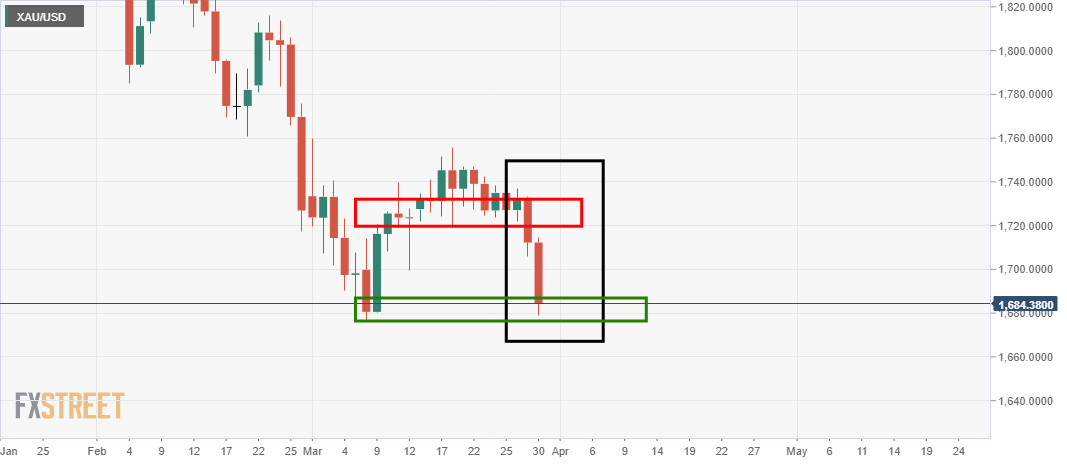
A correction from support could be on the cards at this juncture:
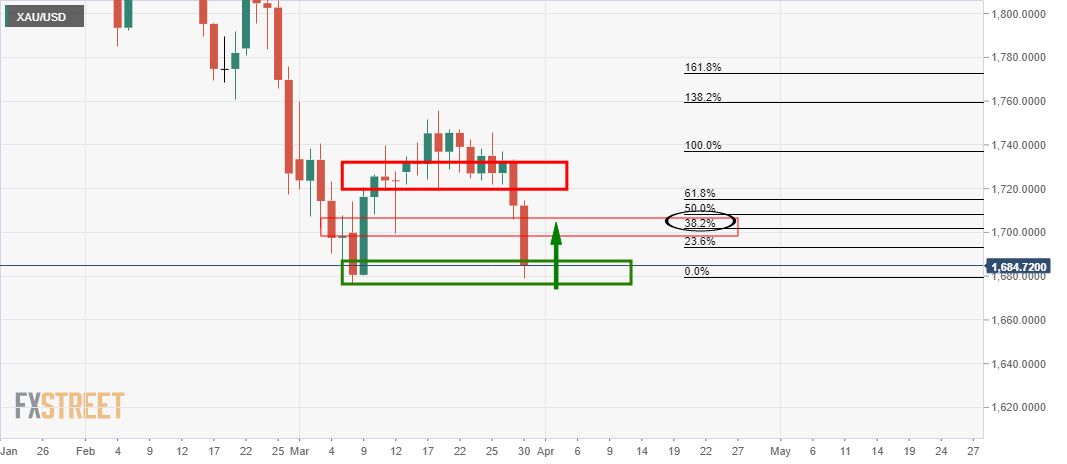
Meanwhile, from a weekly perspective, the price is meeting a strong level of support but following a daily correction, or should the bears keep with the momentum, then a downside extension would be on the cards.