- Gold is testing the bear’s commitments at hourly resistance.
- Momentum reaches resistance and 10-SMA could come under pressure.
As per the prior analysis from the New York session, Gold Price Analysis: Monthly support being tested, bulls eye 38.2% Fibonacci retracement, in a closer analysis, there are prospects for a slight downside extension deeper into the monthly support area.
Prior analysis, Weekly chart
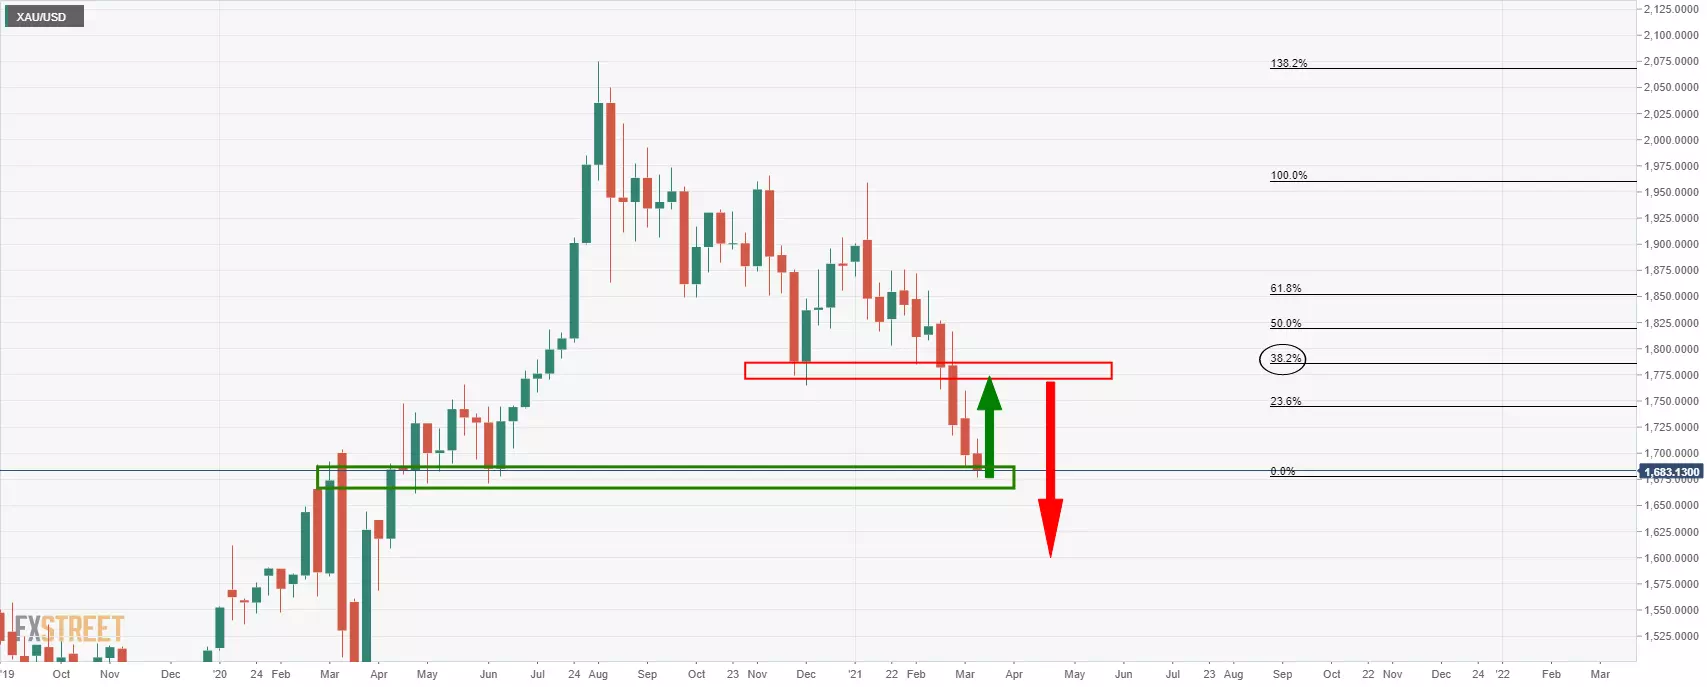
The weekly chart offers a target of confluence between the recent lows and a 38.2% Fibonacci retracement.
Daily chart
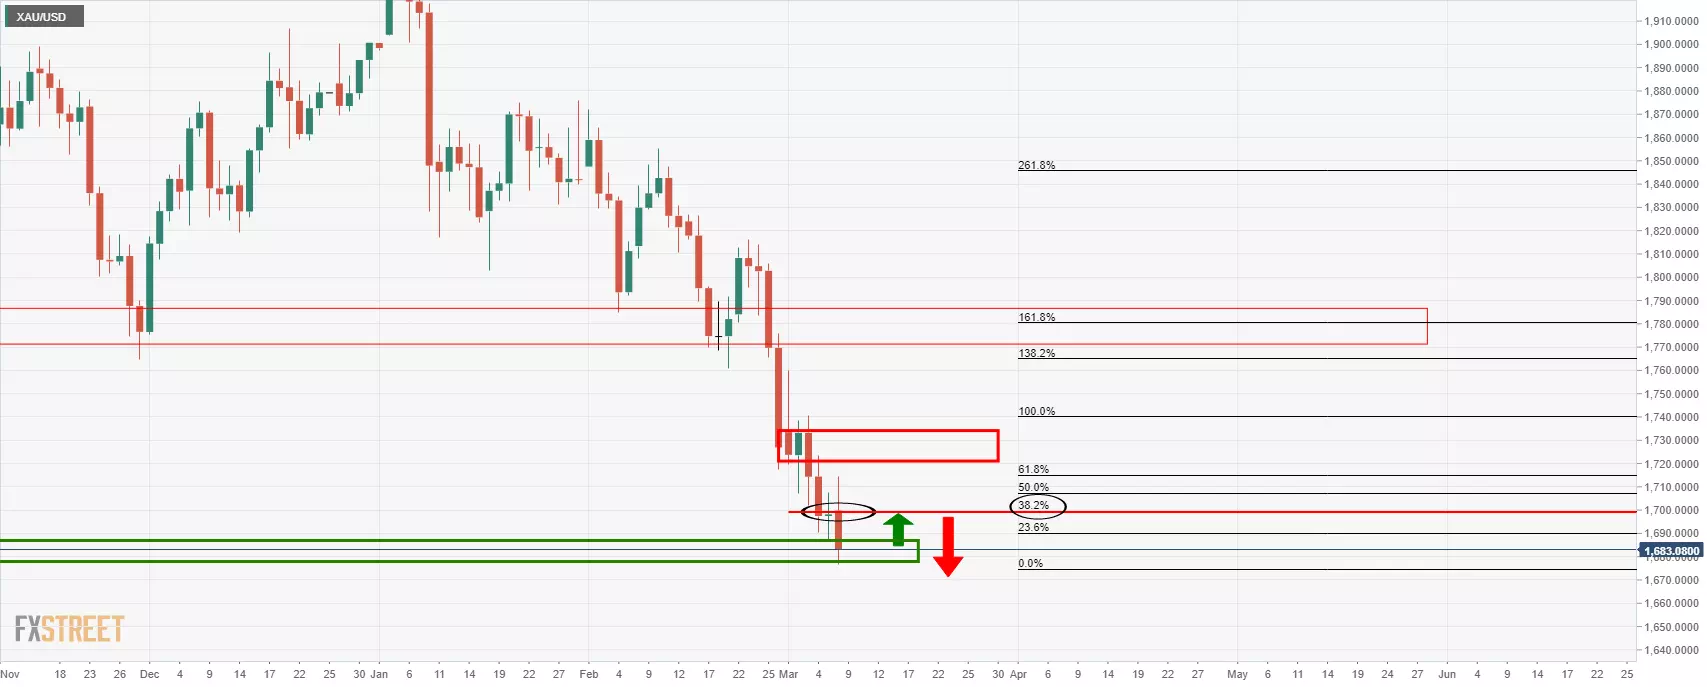
Meanwhile, however, if the price is rejected by near term resistance, there is the possibility of a deeper test into the monthly demand area.
Live market, 1-hour chart
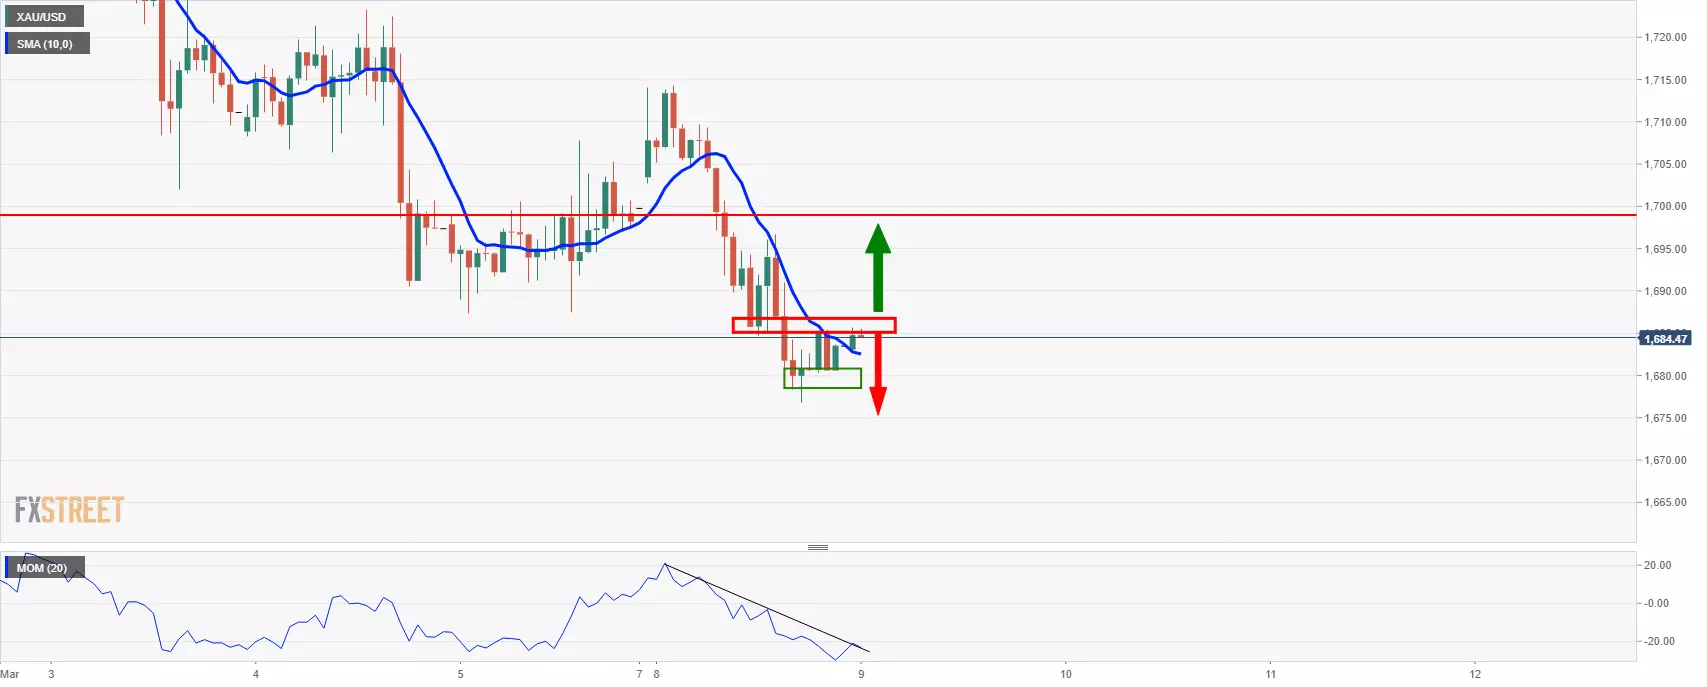
Meanwhile, from a live market and hourly perspective, the price can continue lower on a break of the 10-SMA and recently cemented support.
Momentum to the upside is meeting resistance which could result in a bearish environment for the bears to take advantage of.
