- Gold prices cling to 50% Fibonacci retracement of its March month pullback.
- The bullion remains weak below the confluence of key SMAs.
- 61.8% Fibonacci retracement, the previous week’s top add to the upside barriers.
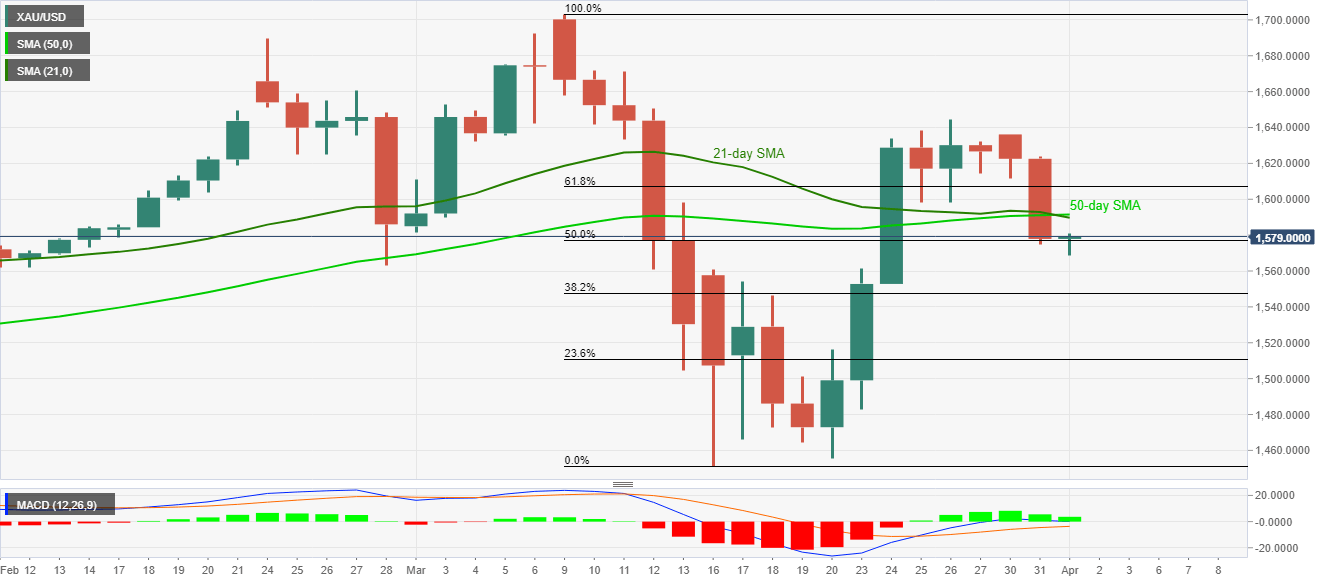
While a sustained break below 21/50-day SMAs portrays Gold’s weakness, the yellow metal seesaws around $1,579/78 amid the Asian session on Wednesday.
The safe-haven currently takes rounds to 50% Fibonacci retracement of its early-March month declines amid bullish MACD.
In addition to the said SMA confluence near $1,590/92, 61.8% Fibonacci retracement level of $1,607 and March 26 high near $1,645 will also challenge the buyers in case of the metal’s fresh upside.
Meanwhile, $1,560 and 38.2% Fibonacci retracement level near $1,548 can offer immediate support during further weakness, which is quite expected.
Should there be a clear weakness below $1,547, 23.6% Fibonacci retracement near $1,511 will be the key to watch as a break of which could recall the previous month lows surrounding $1,445.
Gold daily chart
Trend: Bearish
