- Gold prices near nine-day high following the latest risk-off moves.
- An upward sloping trend line from early-January can please the buyers beyond the yearly top.
- 50-day SMA and eight-week-old horizontal support line will restrict near-term declines.
Despite witnessing a pullback from the nine-day high flashed during Thursday, Gold buyers remain hopeful as the bullion nears the record high amid bullish MACD. The yellow metal takes rounds to $1,669.76, down 0.16%, at the start of the Asian session on Friday.
While the previous day’s high surrounding $1,675 acts as the immediate upside barrier, February month top, also the multi-year peak, around $1,690 becomes the key for the bulls.
Should there be a further upside beyond $1,690, which is more likely based on the technical as well as the fundamental point of view, $1,700 and an ascending trend line joining the highs marked in January and February, currently near $1,710, will lure the traders.
On the downside, $1,660 can act as immediate support ahead of $1,650/48 and $1,630 rest-points.
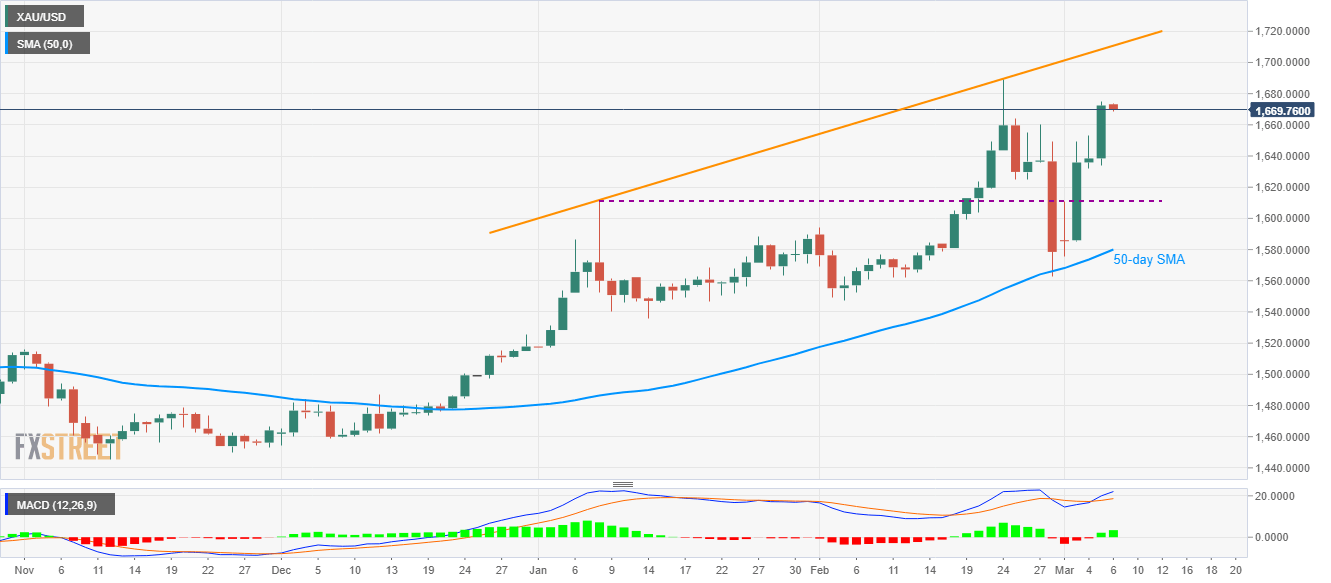
However, the precious metal’s declines below $1,630 will be challenged by a horizontal line established since January 08, around $1,611, a break of which could recall a 50-day SMA level of $1,580 on the charts.
Gold daily chart
Trend: Bullish
