- XAU/USD bulls are stepping in at a demand zone ina phase of accumulation.
- Bulls can target a weekly 61.8% Fibonacci retracement of the recent weekly bearish impulse.
Gold prices are meeting a longterm demand area and the focus is on the upside.
The following is a top-down analysis that illustrates where the next opportunity with the correction could come of a break of near term resistance.
Monthly chart
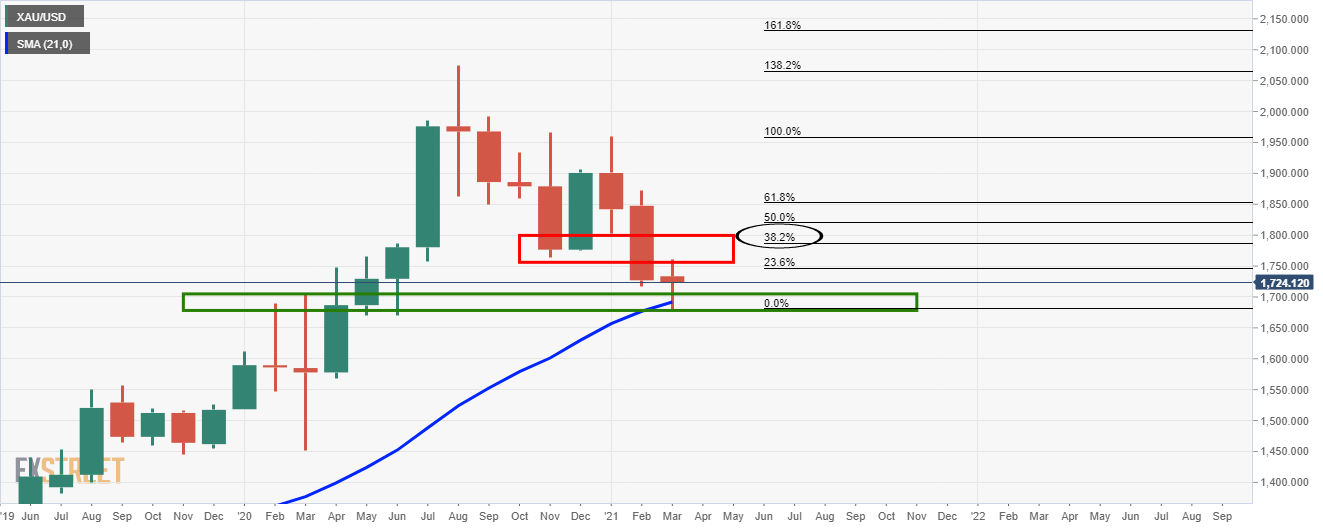
The bears are challenging the bull’s commitments at this juncture from the 21-SMA and confluence of old resistance.
Weekly chart
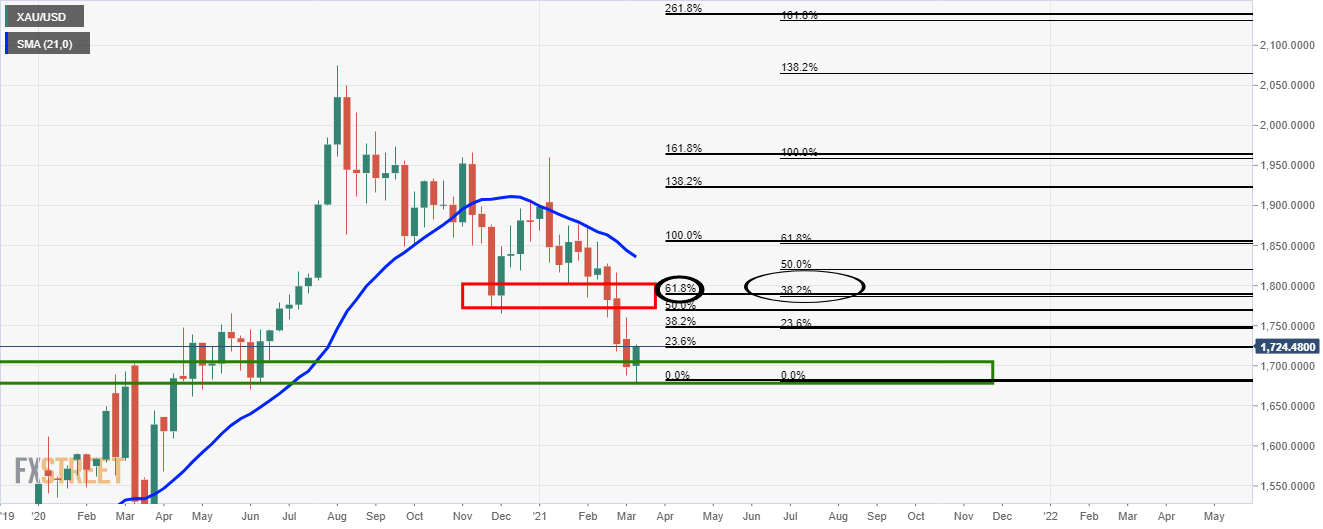
From support, the price ca retrace to a 61.8% Fibonacci target.
Daily chart
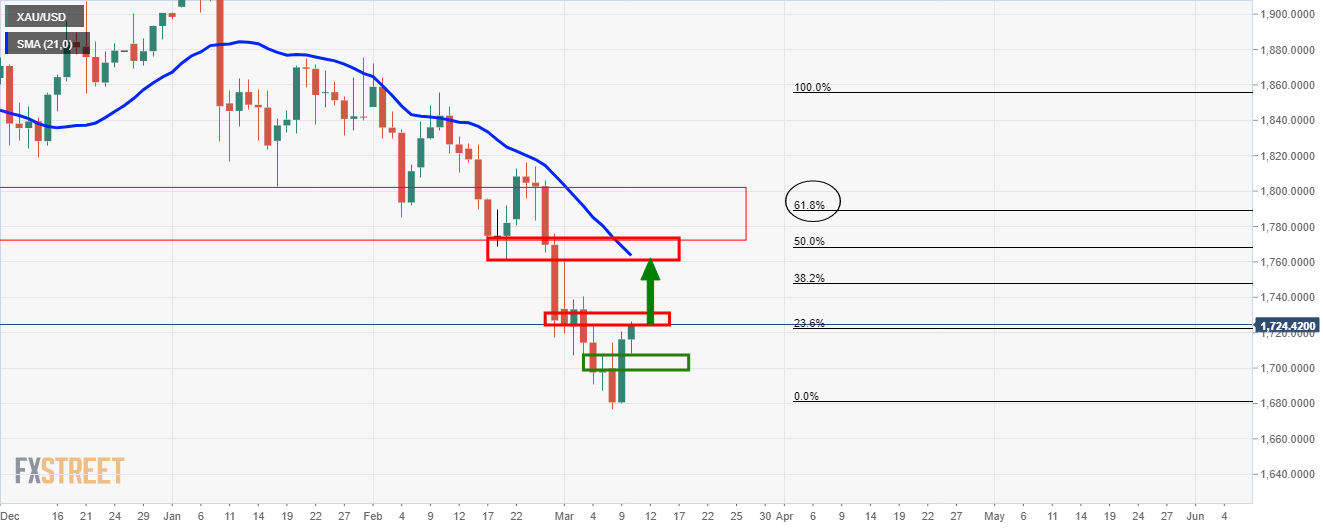
The daily chart is trapped between support and resistance, but on a break of the resistance, bulls can target a 50% mean reversion ahead of the weekly 61.8% Fibo target.
4-hour chart
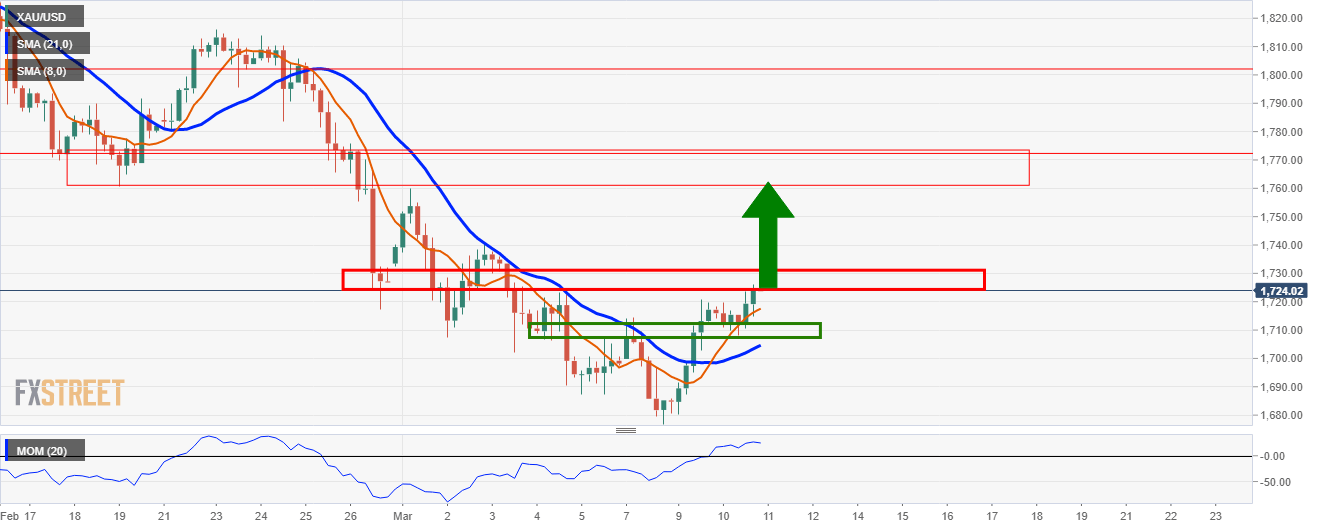
The 4-hour chart is strongly bullish, determined by Momentum over the zero line and the 8/21 SMA crossover.
1-hour chart
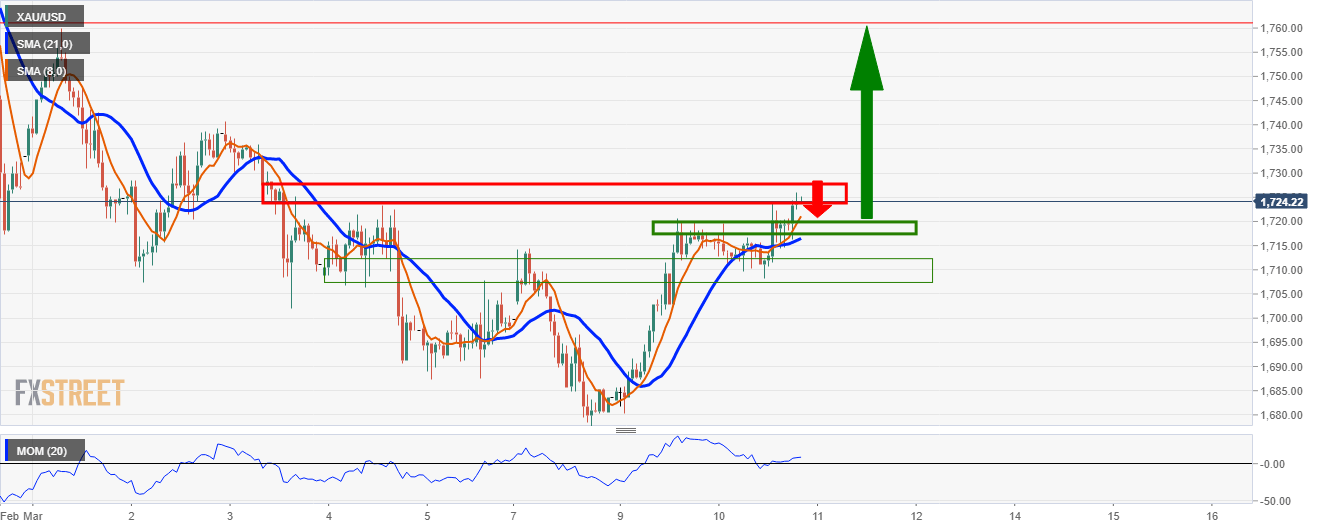
The price is in bullish territory determined by Momentum over the zero line and the 8/21 SMA crossover.
On a retest of the current support, the bulls can engage and target the upside towards $1,760.
