- Gold prices fail to hold onto the early-day recovery gains, slips beneath 200-day SMA.
- A confluence of 100-day SMA, 38.2% Fibonacci retracement limit near-term upside.
- November 2019 low, 61.8% Fibonacci retracement on the bears’ radars.
Following the latest pullback from $1,520, Gold prices decline to $1,493, down 1.27%, as the global markets await European traders on Tuesday.
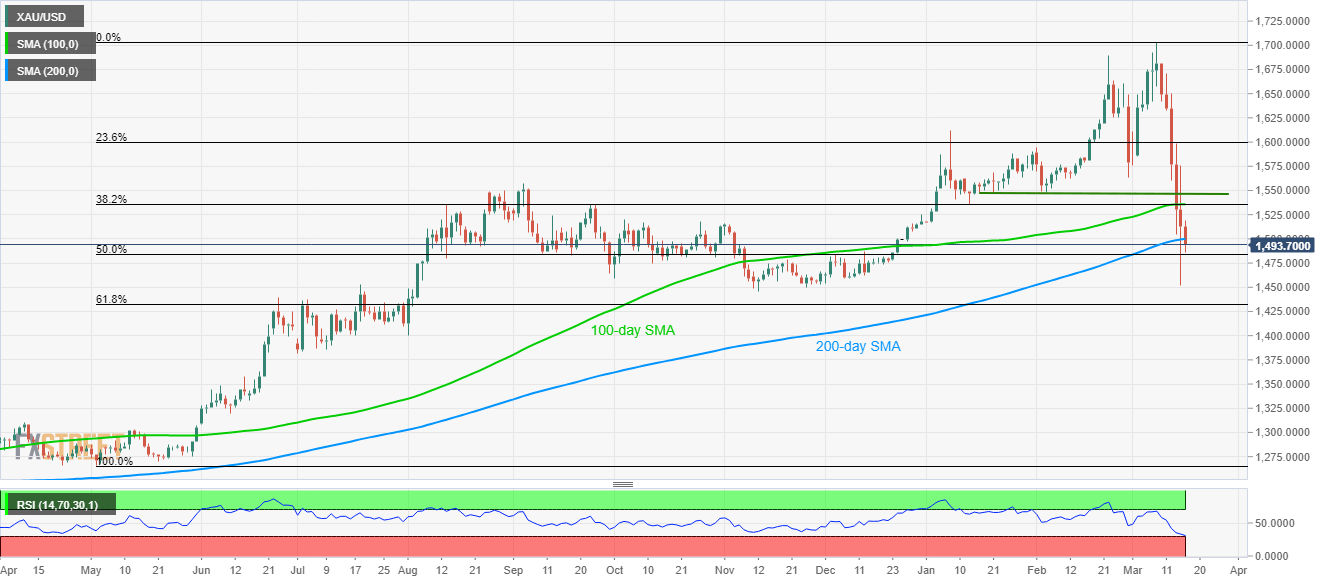
With that, the bullion slips back below 200-day SMA while inching closer to 50% Fibonacci retracement of its run-up from May 2019 to March 2020, at $1,483.
During the quote’s further downside below 50% Fibonacci retracement, November 2019 low surrounding $1,445 and 61.8% of Fibonacci retracement near $1,432 can please the bears.
On the flip side, a confluence of 100-day SMA and 38.2% Fibonacci retracement restricts the yellow metal’s short-term recovery moves near $1,535/36.
Beyond that, lows marked during late-January 2020, also during the February month, around $1,545/46, could question the bulls.
Gold daily chart
Trend: Further declines likely
