- Gold is over 1% higher as safe-haven demand picks up in the US session.
- The Elliott Wave 1-2 low is the resistance level to watch out for.
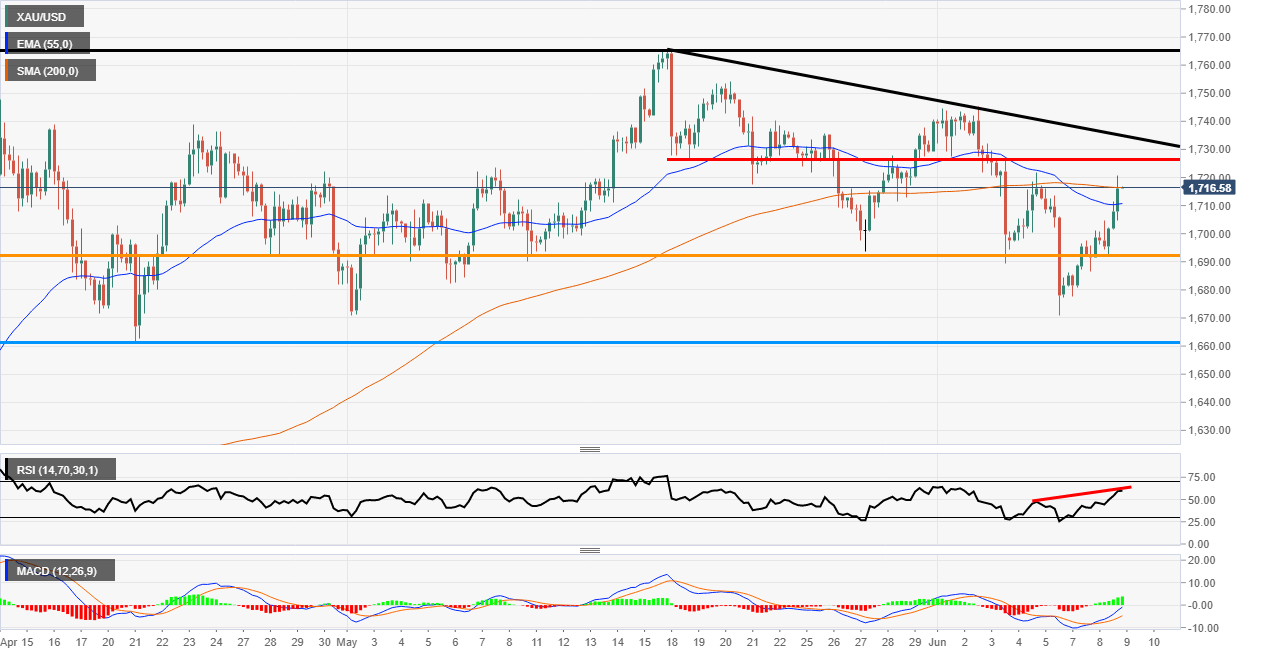
XAU/USD 4-hour chart
Gold has been pushing higher in the last couple of sessions and now the bulls have broken back above the USD 1700 per troy once level again. At the moment on the chart below the 200 Simple Moving average is providing some resistance as the bulls gain control.
The main resistance on the chart is the red horizontal line at USD 1725.96 per troy ounce. This is where the wave 1-2 low resides and if broken would negate the new longer Elliott five-wave pattern to the downside and insinuate the move is an ABC correction down to USD 1670.76 per troy ounce. The good news is it won’t be too long till we find out as the market is only USD 10 away from the zone at the time of writing.
The indicators at the moment are looking bullish but there is a worrying sign on the Relative Strength Index (RSI). The RSI is showing a bearish failure swing. This is when the price makes a lower low wave and the indicator a higher high wave. This is pointed out by the red line on the RSI indicator. The MACD, however, is looking positive with the histogram in the green and the signal lines looking like they may move above the mid zone.
Additional levels
