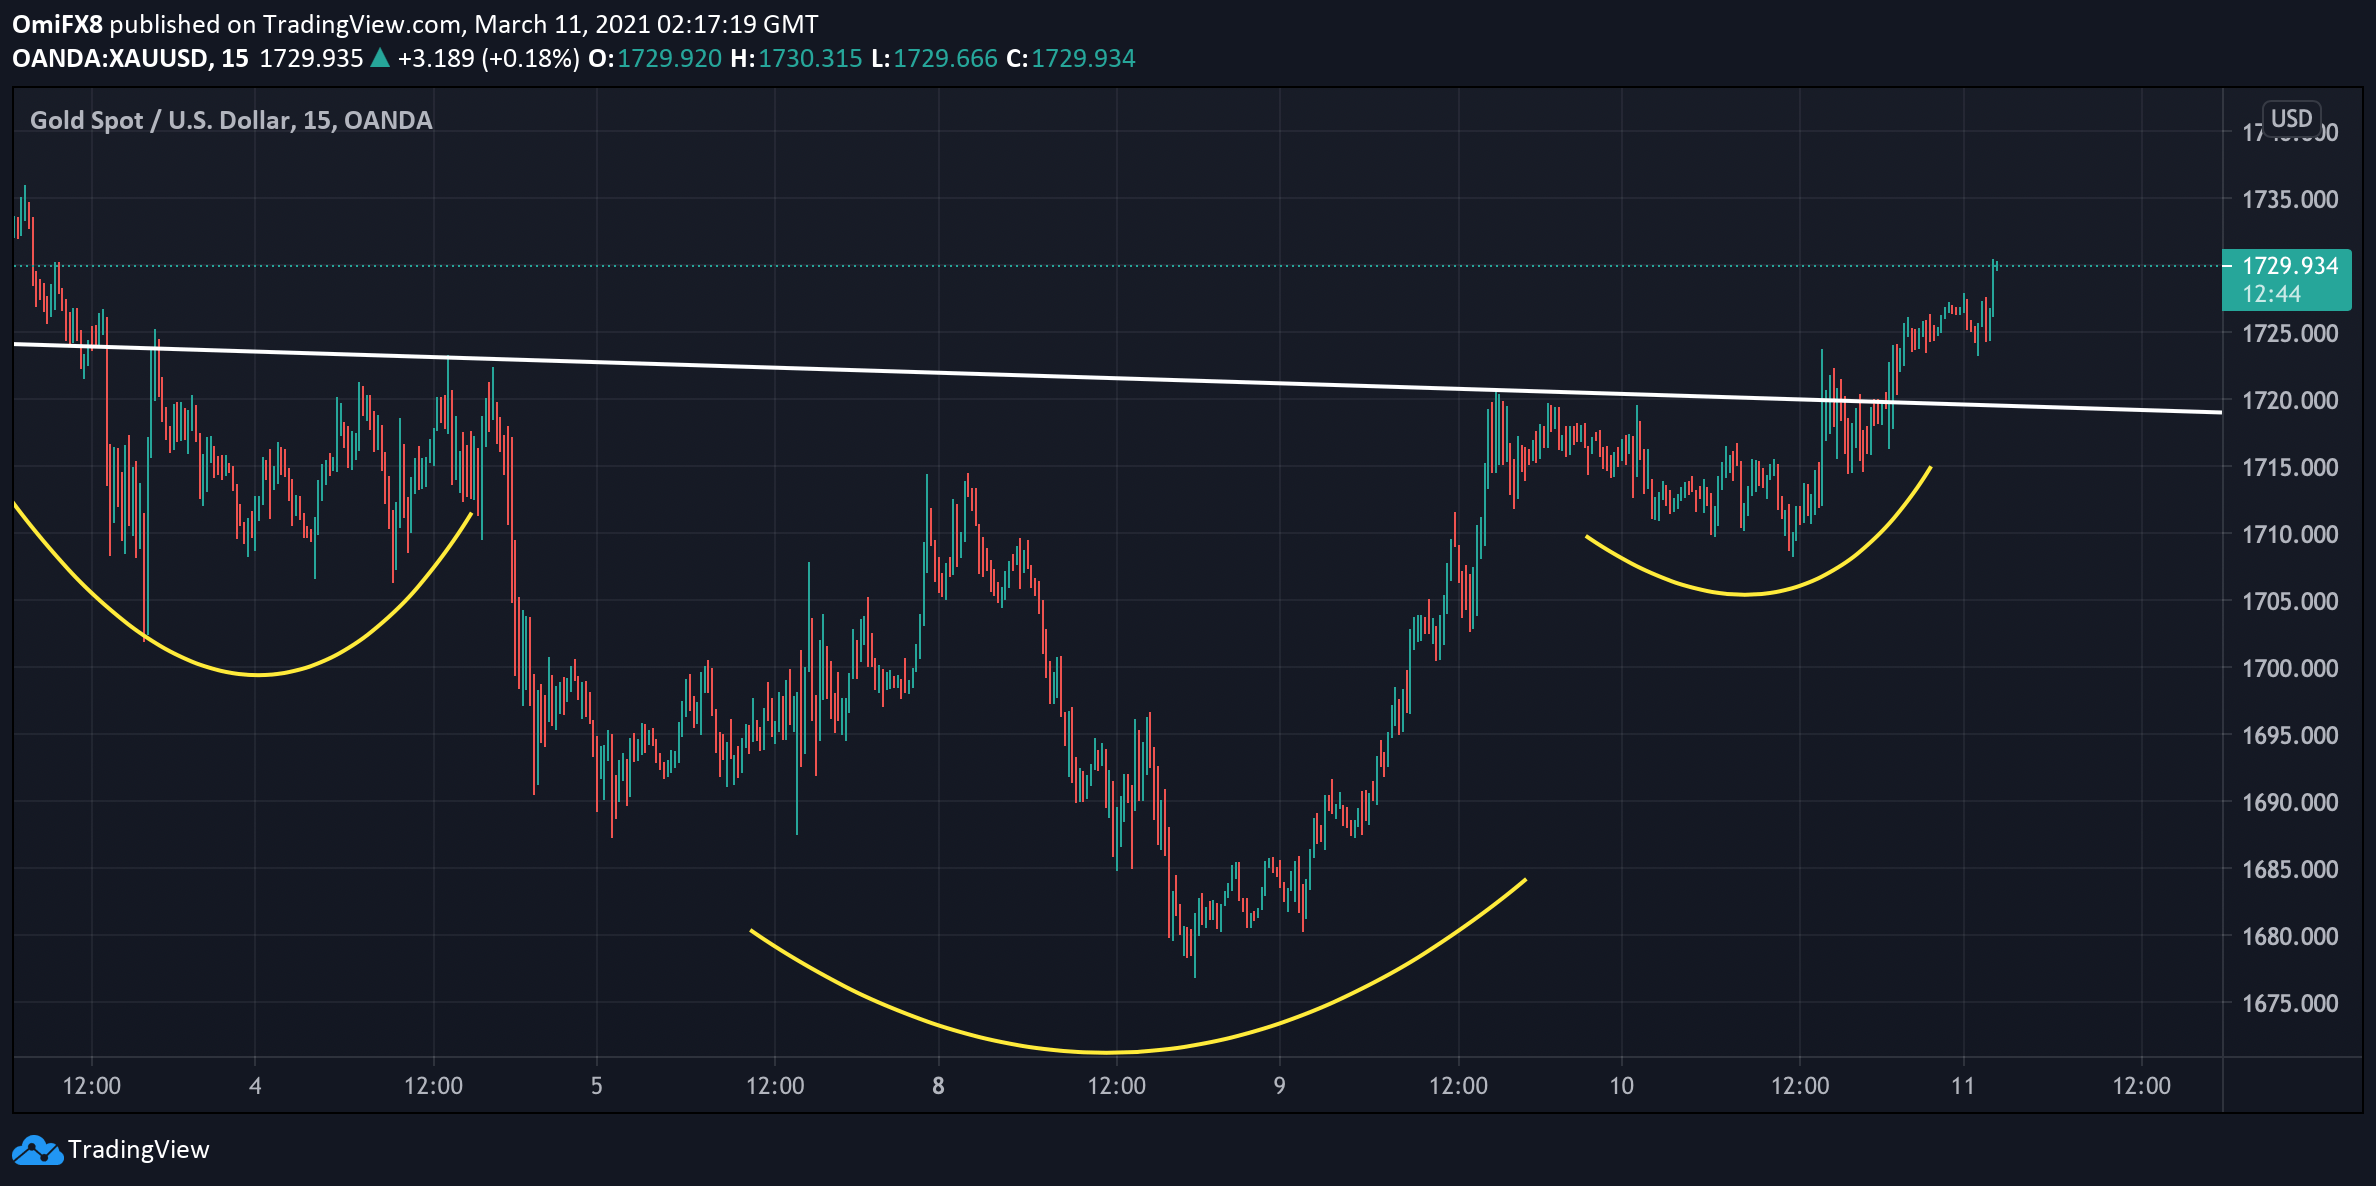
- Gold’s intraday chart shows scope for a stronger corrective rally.
- Macro factors, however, are aligned in favor of the bears.
Gold is trading near $1,730 per ounce, having risen from $1,680 to $1,720 in the previous two trading days.
The metal’s 15-minute chart shows an inverse head-and-shoulders breakout, a bullish reversal pattern. The breakout has opened the doors for a rally to $1,764 – the target as per the measured move method.
The bullish bias would be invalidated if prices drop below the former hurdle-turned-support of the inverse H&S pattern.
President Joe Biden’s $1.9 trillion stimulus plan approved by Congress on Wednesday is expected to power the US economy to its strongest economic growth rate in 40 years. Further, it could amplify inflation concerns, strengthening the case for an early tightening by the Federal Reserve (Fed).
If that happens, the yellow metal will likely face selling pressure. Gold has declined by nearly 9% this year with markets bringing forward the timing of the first Fed rate hike to December 2022 from 2024 in the wake of rising inflation expectations.
15-minute chart
Trend: bullish
Technical levels

