- After another +$30 drop, gold prices have stabilised above the $1800 level for now, weighed by a risk on market tone.
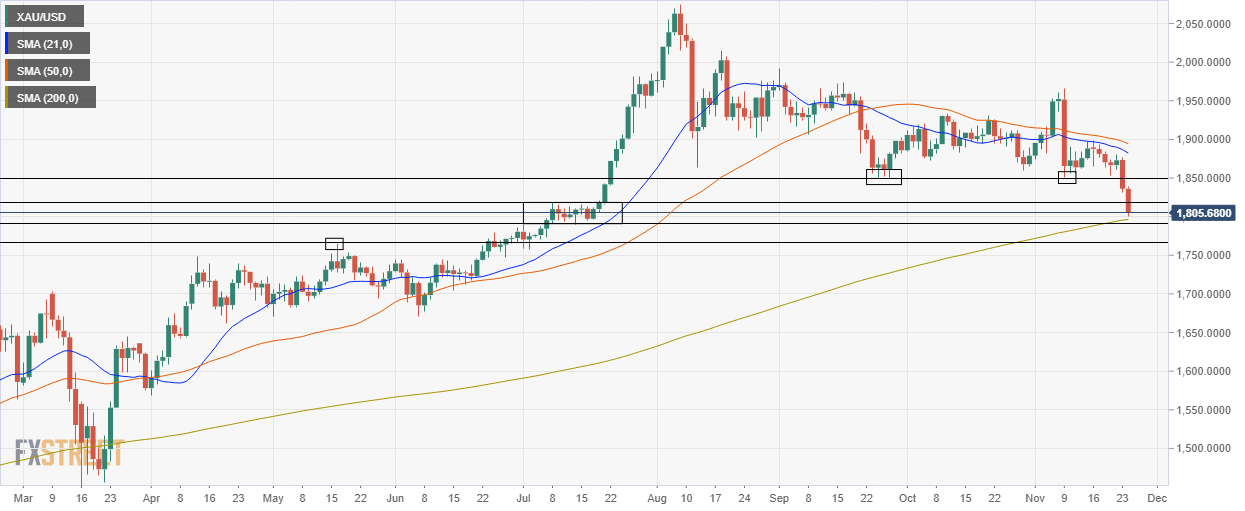
- Gold’s 200DMA sits just to the downside at $1796, while significant resistance lies to the upside at $1850.
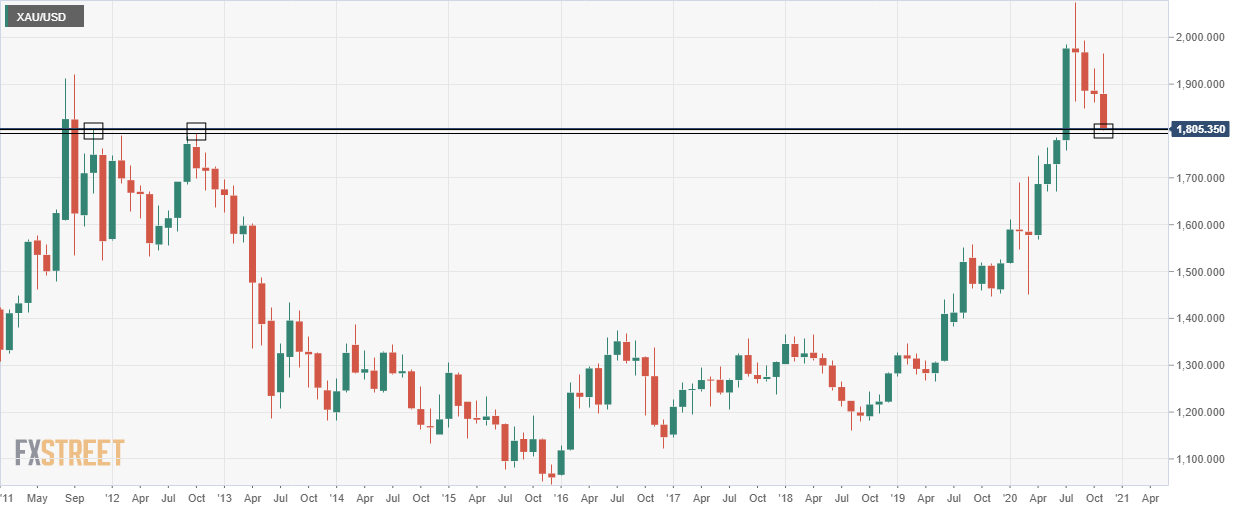
Spot gold (XAU/USD) seems to have survived a test of the psychological $1800 level for now, with buyers coming in ahead of the November 2011 and October 2012 highs (at $1803 and $1796 levels respectively). Gold prices have traded within a thin $1802-$1807 range over the past few hours, as gold market participants catch their breath ahead of the next move. As things stand, the precious metal trades lower by over $30 on the day or down 1.8%.
Risk on flows undermine precious metal demand
Precious metals have taken a beating thus far this week, with silver prices down nearly 4% and gold prices down nearly 3.5%. The sell-off was initially triggered by further positive vaccine news from AstraZeneca prior to Monday’s European equity cash open. Better than expected vaccine news in November has given market participants more confidence that the global economy can enjoy a strong post-pandemic economic recovery in 2021 reducing demand for safe havens such as gold and silver.
Moreover, precious metals markets were dealt a further blow later on during Monday’s European session by much stronger than expected US Markit PMI data for November, that showed that vaccine optimism had more than made up for concerns about the return to lockdowns over winter, as well as revealing increased inflationary pressures across the economy.
Further evidence of the stronger than expected performance of the US economy came on Tuesday in the form of much stronger than expected S&P/CaseShiller house price data, which had prices up 6.6% YoY in September.
Analysts will argue that such strong data, combined with recent vaccine optimism and the fact that US stock markets are at or close to all-time highs undermines the case for further stimulus from the Fed in December. Most still expect the Fed to expand their QE purchases to longer-dated maturities, but the argument to increase the total monthly purchase size from $80B have clearly been weakened by recent developments.
Given the above, precious metals, which typically do well when central banks ease as market participants hedge themselves against the risk of higher future levels of inflation, have not fared well thus far on the week, and the downside might not be over just yet.
Weaker USD to save gold from further declines?
One factor that might come to the aid of precious metals such as gold is if the US dollar continues to weaken. However, the reasons behind why the USD is weakening will be important here;
If USD is weakening given growing hope for a much faster than anticipated global economic recovery in 2021, aided by a faster than expected end to the pandemic given recent vaccine advances, implying global central banks need not throw more stimulus at global financial markets, this might not end up being positive for gold.
If the 2021 economic recovery turns out to be a disappointment despite recent vaccine advances and the economic scarring left behind by the pandemic worse than expected, then global central banks might be inclined to ease policy further (perhaps the BoE, RBA and RBNZ would actually take rates negative, while the ECB might cut again). If global economic underperformance turns out to be led by the US, meaning a significantly more accommodative Fed, then this might also turn out to be a USD negative, and would certainly be a positive for gold.
Gold trading at lows since July
XAU/USD is currently trading at its lowest levels since mid-July and has entered a key mid-July range between $1790-$1820. Thus, aside from the $1800 level, the upper and lower bounds of this range are likely to present key areas of support and resistance.
Another significant level of support to the downside will be gold’s 200-day moving average (DMA), which sits just below current levels at $1796. If the bottom of the mid-July range and 200DMA do go (that would mark the first gold had fallen below its 200DMA since March), then that would open up the door to a test of the next major area of support at $1766 (the 18 May high).
Conversely, if the bulls roar again and the precious metal break to the upside of the mid-July range, significant resistance lies at $1850 (the 9 November and 24, 25, 26 September lows).
XAU/USD monthly chart
XAU/USD daily chart
 More key levels
