Gold extends its choppy trend after refreshing all-time-highs at $2075 in early Asia. The metal lacks a clear directional bias heading into the critical US NFP. ‘Buy the dips’ will remain in vogue alongside the US dollar dynamics amid a resurgence of the US-China tensions.
The dollar comeback amid risk-aversion, flagged after US President Trump banned the Chinese apps, stalled the bullish momentum in gold. The US payrolls will remain the key decider for gold’s next direction. Although a correction cannot be ruled out.
How is it positioned technically? Key levels to watch
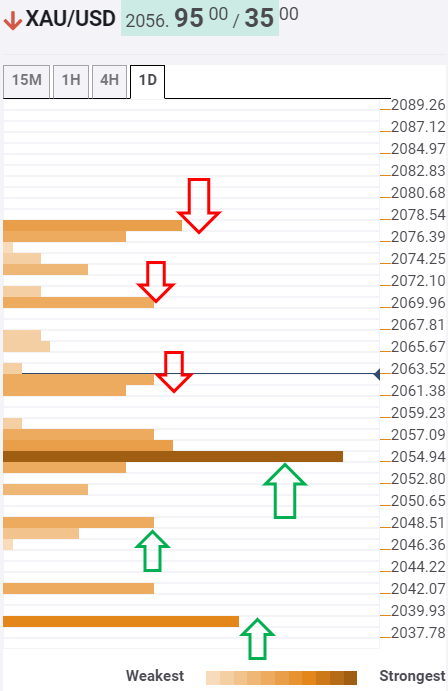
The tool shows that the bright metal sees immediate cushion at $2054, which is the pivot point one-month R1 and powerful support.
A break below the latter will open floors towards the Fibonacci 61.8% one-day and intraday low at $2049.
The next downside target is aligned at $2042, the pivot point one-day S1. Bears may face difficulty clearing the next support at $2038, which is the pivot point one-week R2.
Alternatively, a bunch of resistance levels is stacked up around $2061/63, the confluence of the Fibonacci 23.6% one-day, SMA5 four-hour and Bollinger Band one-hour Middle.
Further north, the previous day high at $2069 will offer some resistance before the spot retest the record highs, with a target to conquer the $2100 mark.
Here is how it looks on the tool
About the Confluence Detector
With the TCI (Technical Confluences Indicator) tool, you can easily locate areas where the price can find a support zone or resistance zone and make trading decisions. If you are a short-term trader, you will find entry points for counter-trend strategies and hunt a few points each time.
Learn more about Technical Confluence
