- Gold holds onto recovery gains from $1,625.
- Normal RSI conditions indicate the continuation of the recovery.
- Key Fibonacci retracements, nearby rising trend line restrict immediate declines.
Gold prices take the bids near $1,650, +0.84%, by the press time of early Thursday. With that, the bullion carries its U-turn marked on Wednesday.
The yellow metal recently reversed from $1,625 and is heading towards multiple resistances around $1,659.
Should prices manage to cross $1,659, as widely expected considering normal conditions of RSI and broadly bullish fundamentals, $1,673 may offer an intermediate halt before fueling prices to the latest high surrounding $1,690.
During the safe-haven’s run-up past-$1,690, $1,700 could please the bulls.
Alternatively, the precious metal’s declines below $1,625 will be challenged by a confluence of 50% Fibonacci retracement of its current month upside and an ascending trend line from February 12, close to $1,618.
In a case where the sellers dominate below $1,618, 61.8% Fibonacci retracement, at $1,601, holds the gate for further declines.
Gold four-hour chart
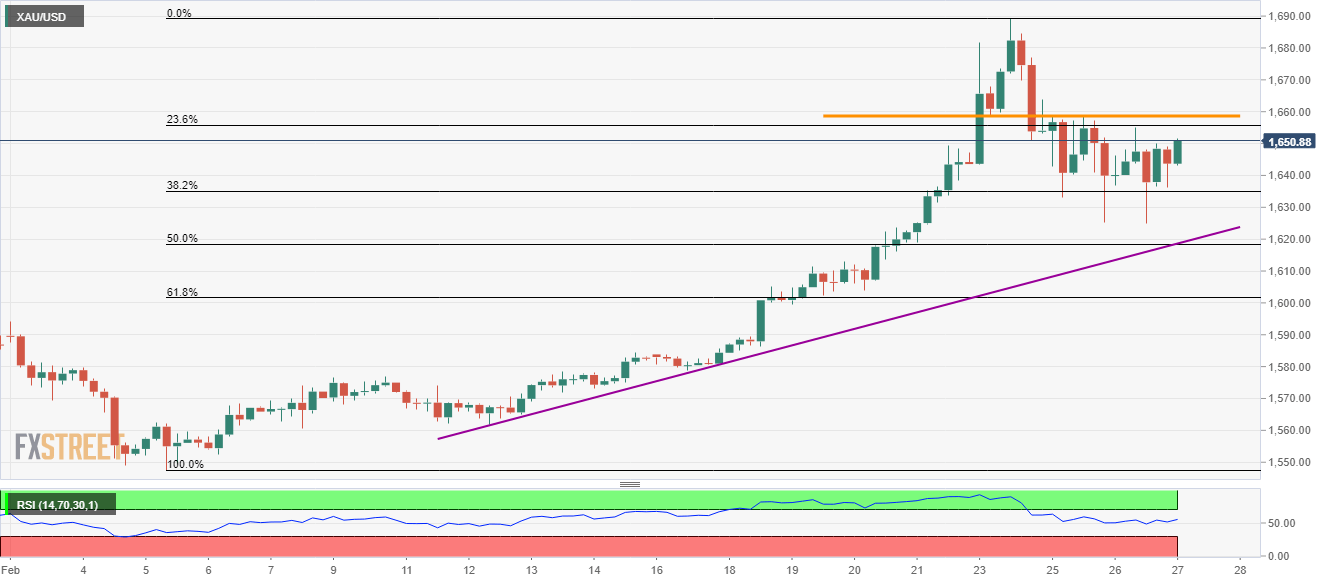
Trend: Bullish
