- Gold prices meet critical support on the daily chart and key resistance on the hourly.
- The US dollar stalls at resistance following a strong up day on Thursday.
At the time of writing, XAU/USD is trading at $1,783.11 and is consolidating in a $3 range in a quiet start to the last Asian session of the week.
Overnight, the commodity complex was pressured and gold prices fell by the same margin as measured by XAU/USD which travelled from a high of $,797.79 to a low of $1,777.28.
A strong US dollar early in the European session was the catalyst where most of the leg work by the bears was done before New York came online.
However, due to better jobless claims, gold dropped again before a drift higher into the close which was met by a falling stock market capping gains.
Initial jobless claims were low again for the second week in a row providing a clear sign the US economy is improving. There were just 547,000 new claims for benefits, well below expectations.
Meanwhile, the stock market doesn’t like the US president’s belief that expenditures can be done on the backs of the wealthiest.
Biden has indicated that he plans to double taxes on capital gains to nearly 40% for the wealthy in order to support those less well off.
Currently, short-term capital gains are taxed at ordinary tax rates (up to 37%) but long-term gains are taxed at lower rates of up to 20%.
Looking forward, next week will be important for not only the Federal Reserve meeting but also the President is expected to release the proposal next week as part of the tax increases to fund social spending in the forthcoming “American Families Plan”.
The news was helping to buoy the greenback which has otherwise suffered at the hands of falling yields for the best part of the current month.
Gold technical analysis
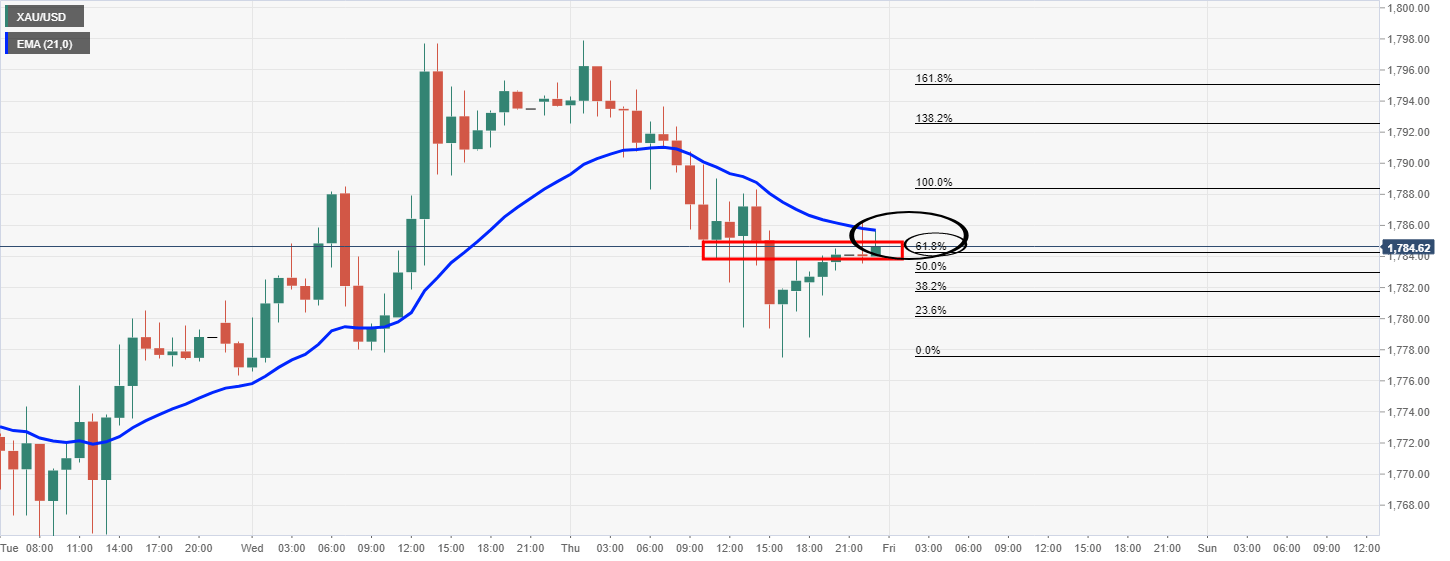
As per the prior analysis, Bulls looking to test hourly resistance structure, the price has indeed stalled at a 61.8% Fibonacci resistance.
Prior analysis, 1-hour chart
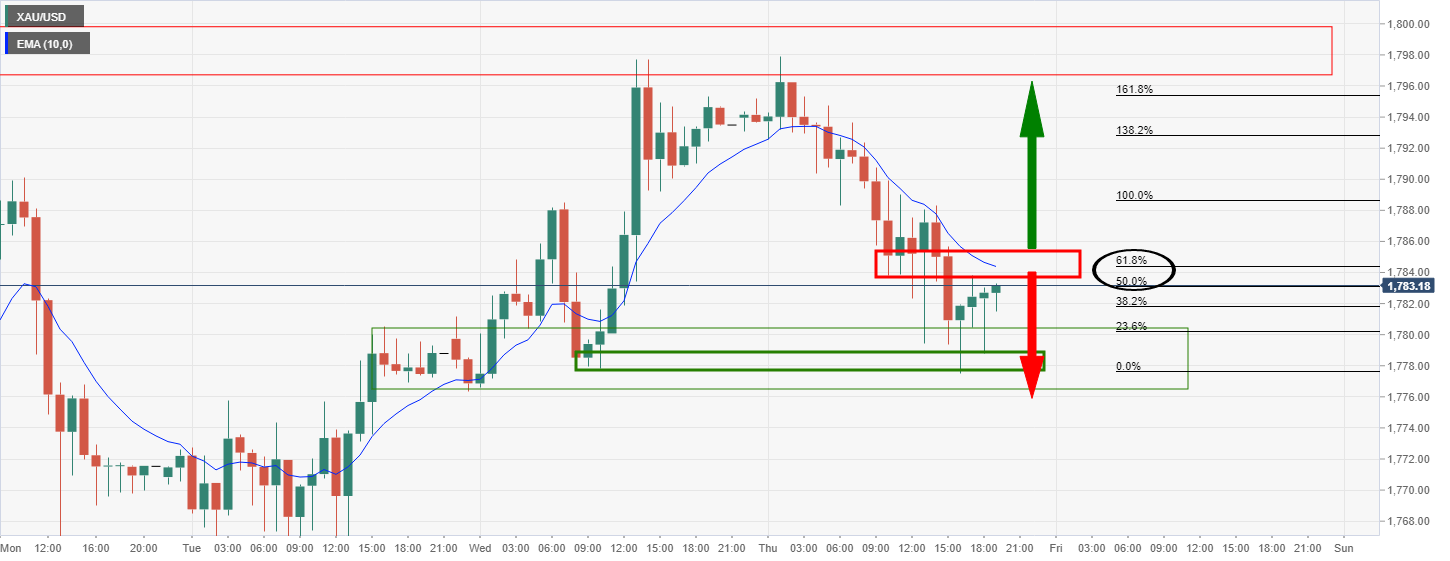
Bulls will need to break the 10-EMA as well as the structure and rise above a 61.8% Fibonacci retracement, or, there is still the probability of a deeper move to the downside and to fully test the bear’s commitments at daily support.
Live market, 1-hour chart
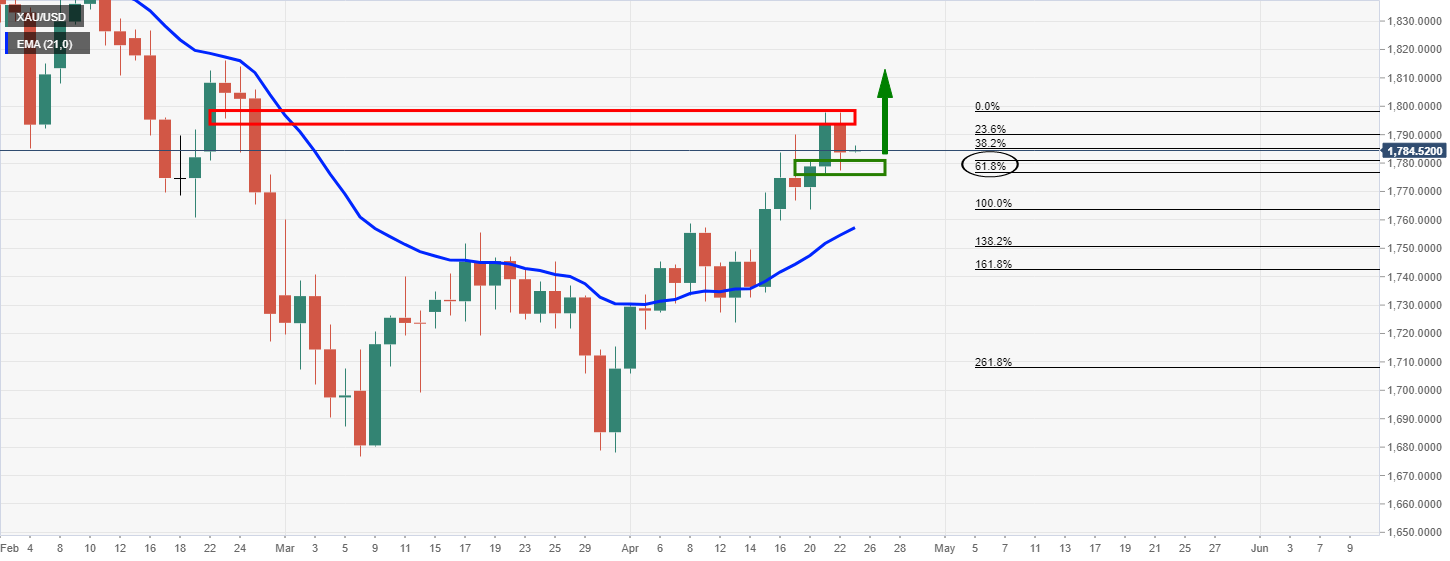
This area may now hold and see the price extend deeper into daily support for the final sessions of the week.
However, on a break of resistance, then the daily resistance will be in focus and there will be prospects of a bullish continuation for the week ahead.
After all, the daily correction has also met a 61.8% Fibo confluence with prior highs: