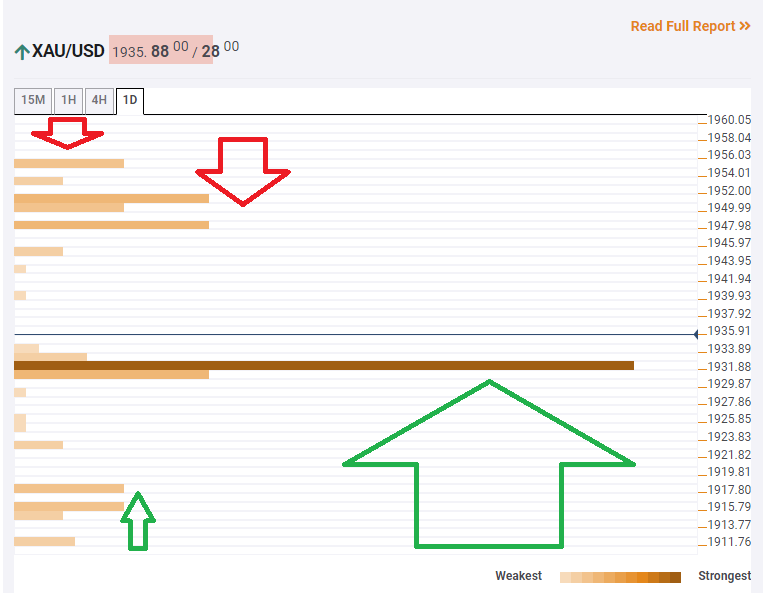
Gold has staged a remarkable recovery, rising some nearly $90 from the lows – yet after crashing around $200 from the all-time highs of $2,075. Higher US bond yields – coming ahead of massive debt issuance – have been attributed to the precious metal’s downfall. However, after XAU/USD entered overbought conditions, a fall was on the cards, even overdue. Sino-American tensions, a bond auction, speeches by Federal Reserve officials, and other events are rocking markets. Russia’s vaccine announcement is also in play. How is gold positioned on the technical charts? The Technical Confluences Indicator is showing that gold has overcome a strong convergence of lines at $1,931, turning resistance into support, and allowing for fresh gains. The noteworthy indicators meeting there including the Bollinger Band 15min-Middle, the Simple Moving Average 10-15m, the Fibonacci 23.6% one-month, and the Fibonacci 23.6% one-day. Looking up, some resistance awaits at around $1,950, which is the confluence of the previous 4h-high and the Fibonacci 38.2% one-day. The next cap is at $1,955, which is where the Simple Moving Average 10-4h hits the price. Below $1,931, the next support line is at $1,917, which is a juncture of lines including the Bollinger Band 1h-Middle and the SMA 5-4h. Key XAU/USD resistances and supports Confluence Detector The Confluence Detector finds exciting opportunities using Technical Confluences. The TC is a tool to locate and point out those price levels where there is a congestion of indicators, moving averages, Fibonacci levels, Pivot Points, etc. Knowing where these congestion points are located is very useful for the trader, and can be used as a basis for different strategies. Learn more about Technical Confluence FX Street FX Street FXStreet is the leading independent portal dedicated to the Foreign Exchange (Forex) market. It was launched in 2000 and the portal has always been proud of their unyielding commitment to provide objective and unbiased information, to enable their users to take better and more confident decisions. View All Post By FX Street FXStreet News share Read Next EUR/USD battles fighting to extend the rally beyond 1.18 FX Street 2 years Gold has staged a remarkable recovery, rising some nearly $90 from the lows – yet after crashing around $200 from the all-time highs of $2,075. Higher US bond yields – coming ahead of massive debt issuance – have been attributed to the precious metal's downfall. However, after XAU/USD entered overbought conditions, a fall was on the cards, even overdue. Sino-American tensions, a bond auction, speeches by Federal Reserve officials, and other events are rocking markets. Russia's vaccine announcement is also in play. How is gold positioned on the technical charts? The Technical Confluences Indicator is showing that gold has overcome a strong… Regulated Forex Brokers All Brokers Sponsored Brokers Broker Benefits Min Deposit Score Visit Broker 1 $100T&Cs Apply 0% Commission and No stamp DutyRegulated by US,UK & International StockCopy Successfull Traders 9.8 Visit Site FreeBets Reviews$100Your capital is at risk. 2 T&Cs Apply 9.8 Visit Site FreeBets Reviews$100Your capital is at risk. 3 Recommended Broker $100T&Cs Apply No deposit or withdrawal feesTrade major forex pairs such as EUR/USD with leverage up to 30:1 and tight spreads of 0.9 pips Low $100 minimum deposit to open a trading account 9 Visit Site FreeBets ReviewsYour capital is at risk. 4 T&Cs Apply Visit Site FreeBets ReviewsYour capital is at risk. 5 Recommended Broker $0T&Cs Apply Trade gold, silver, and platinum directly against major currenciesUp to 1:500 leverage for forex trading24/5 customer service by phone and email 9 Visit Site FreeBets ReviewsYour capital is at risk.